Objectives
The purpose of this project is to illustrate the historical racial trauma in African Americans via tracing the linkage between 1918 flu pandemic and COVID-19 in Illinois. The project consists of three part of works: 1) digitizing and geoprocessing for historical analog data into digital resources, 2) identifying the neighborhood for each race, and 3) comparison between neighborhood and its mortality rate. As a part of result, several maps will be produced to achieve. This notebook would ptovide the intuition which racial group and factors were associated with the excess death rate in Chicago during pandemic.
1. 1918 Influenza and pneumonia and COVID-19 data
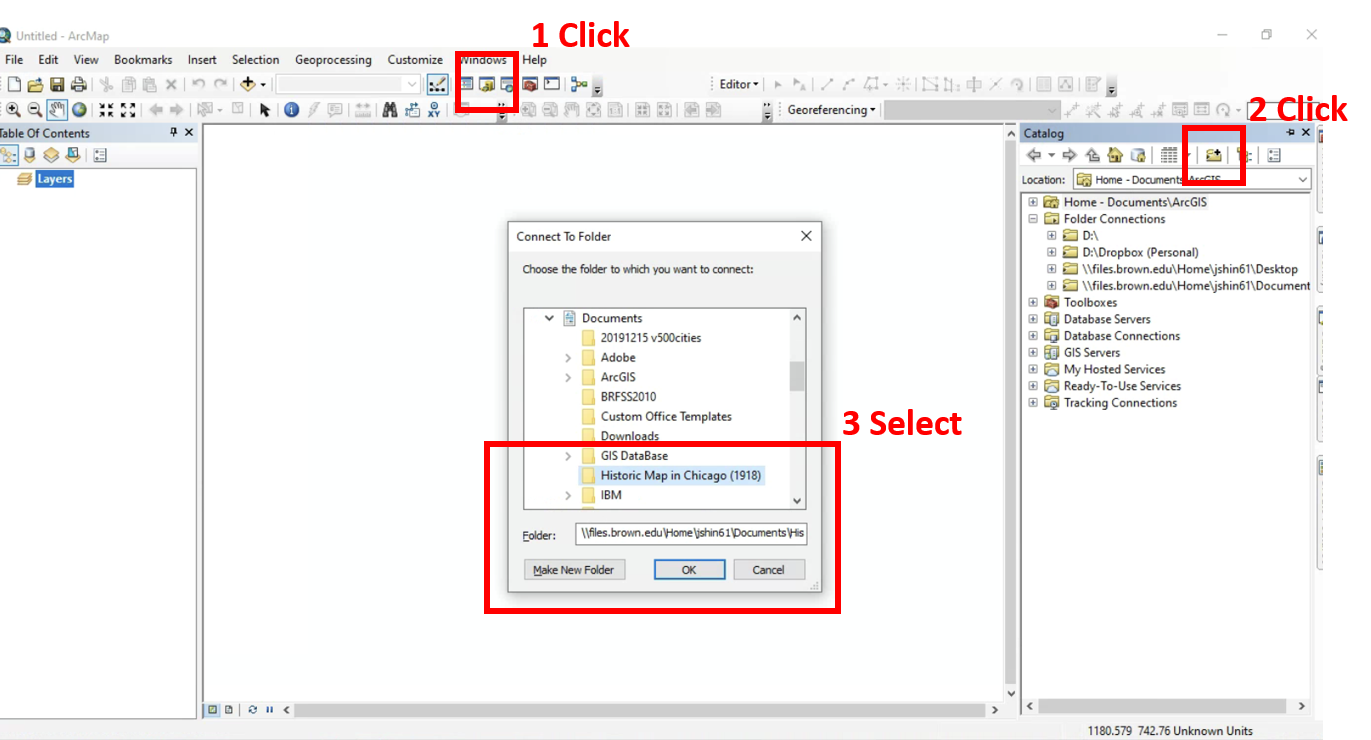
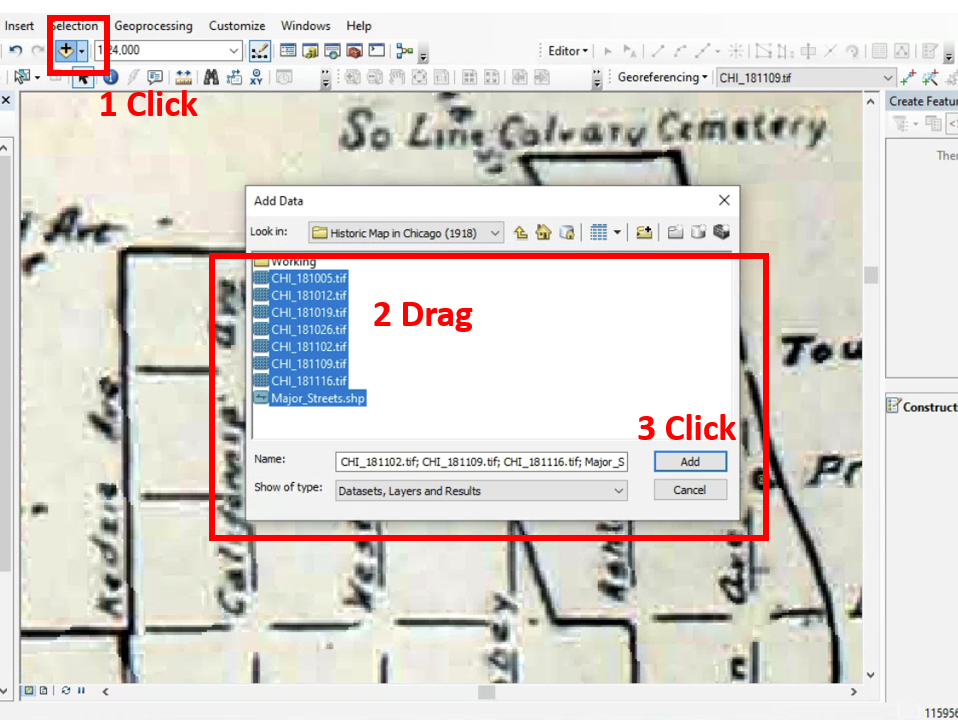
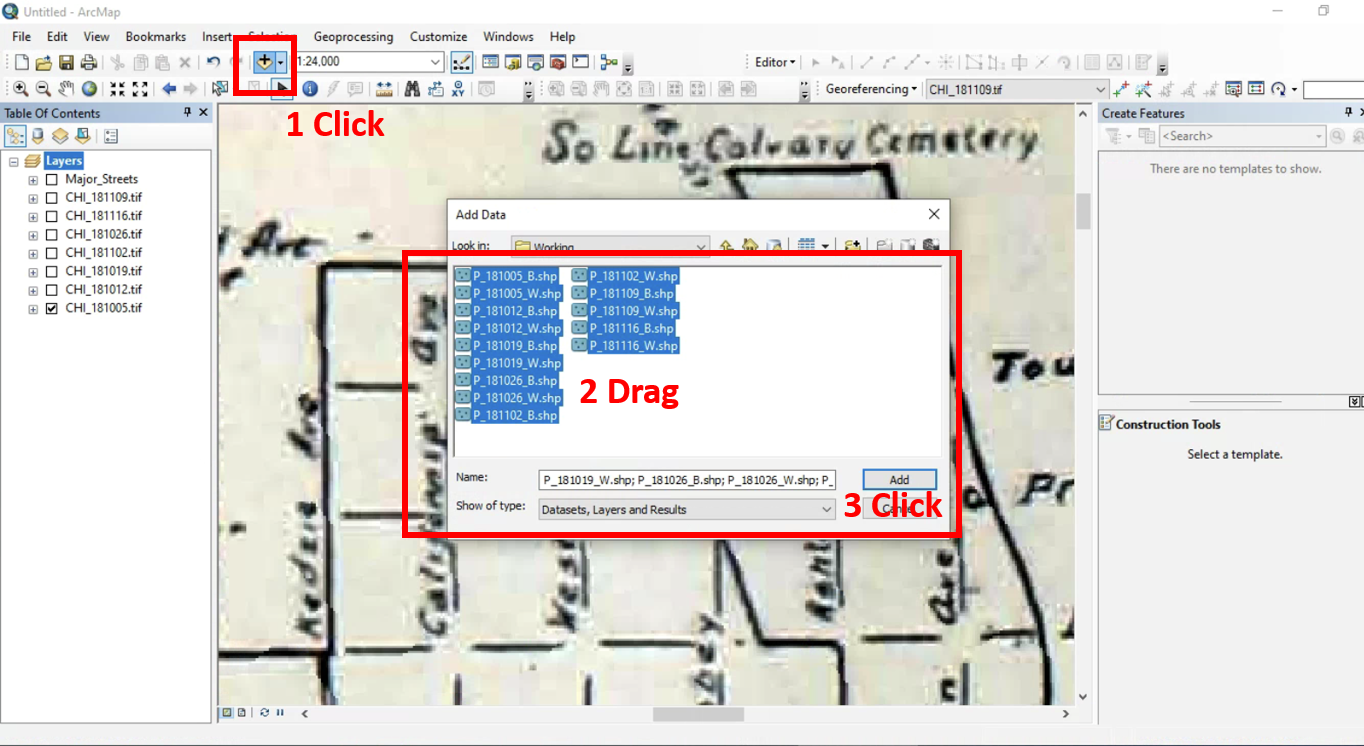
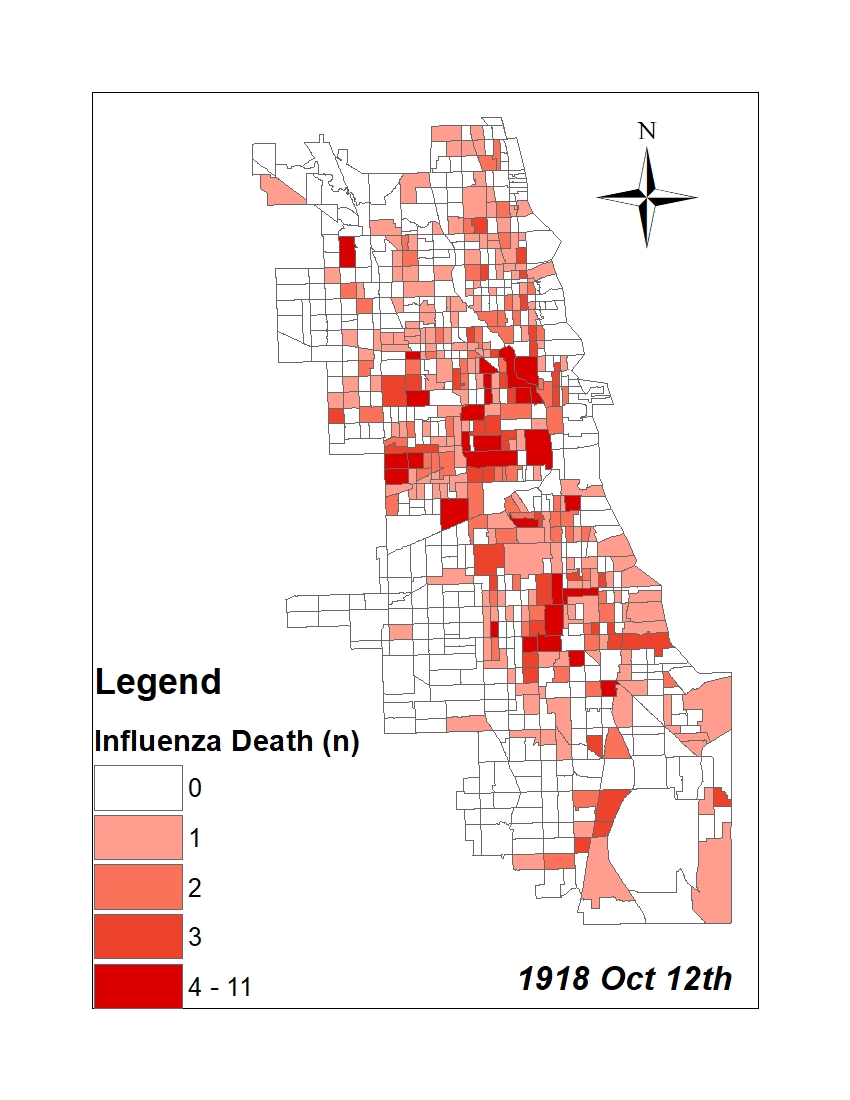
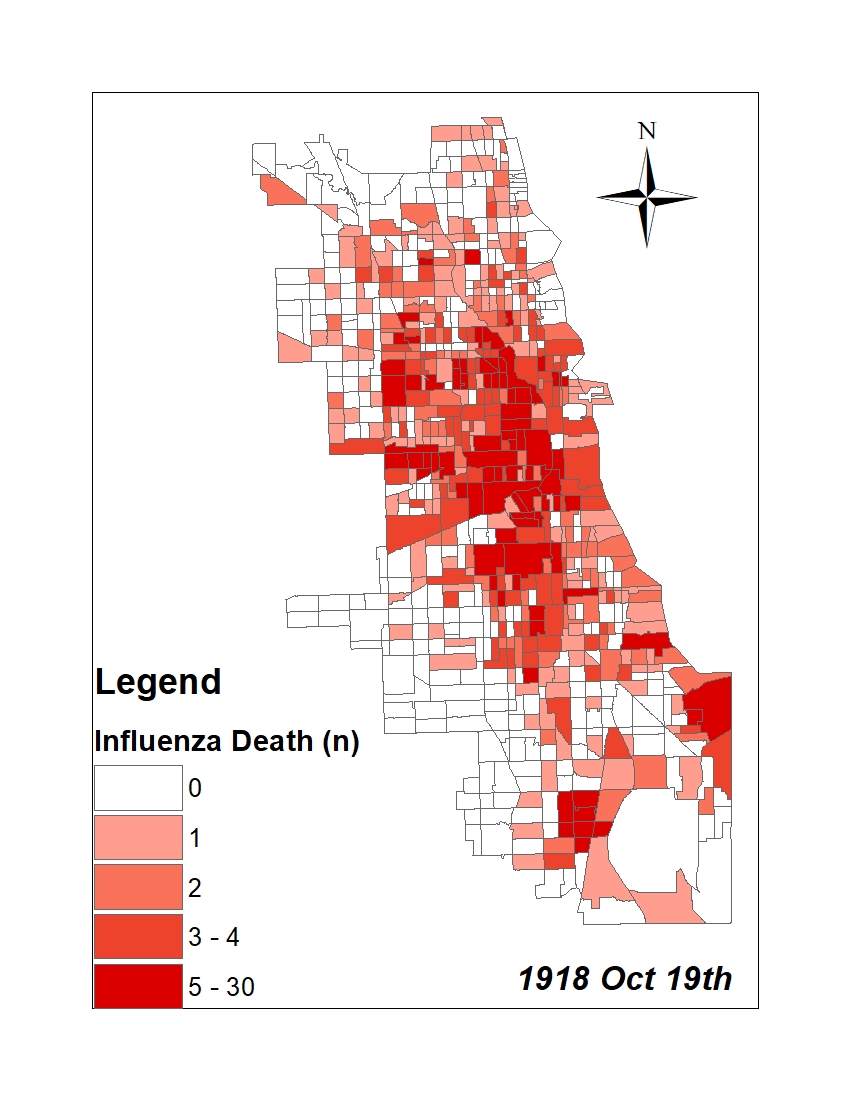
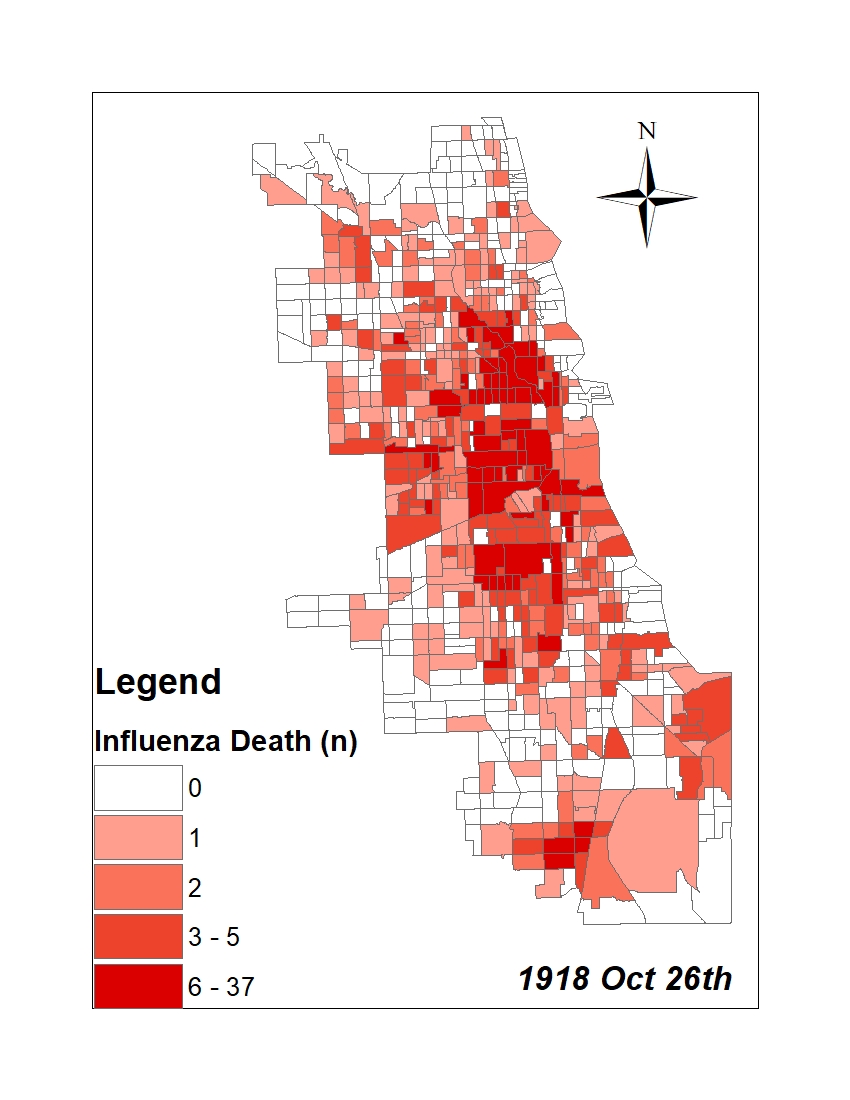
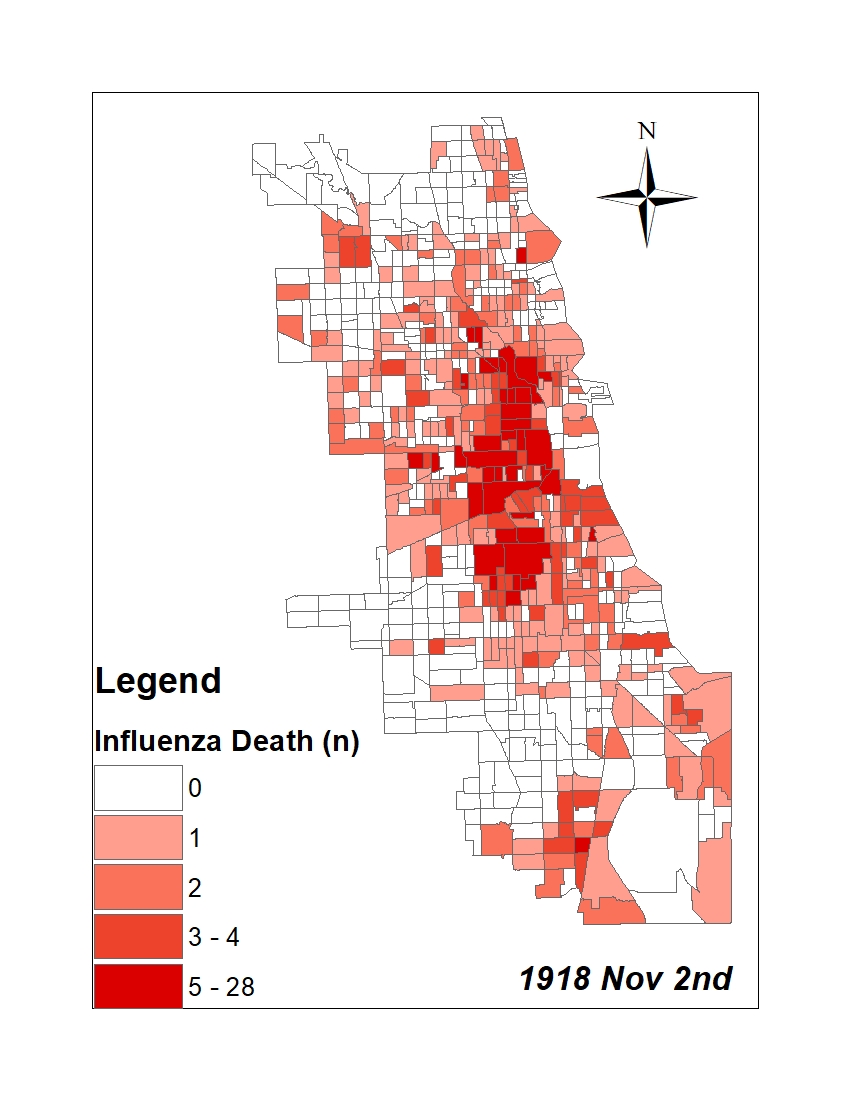
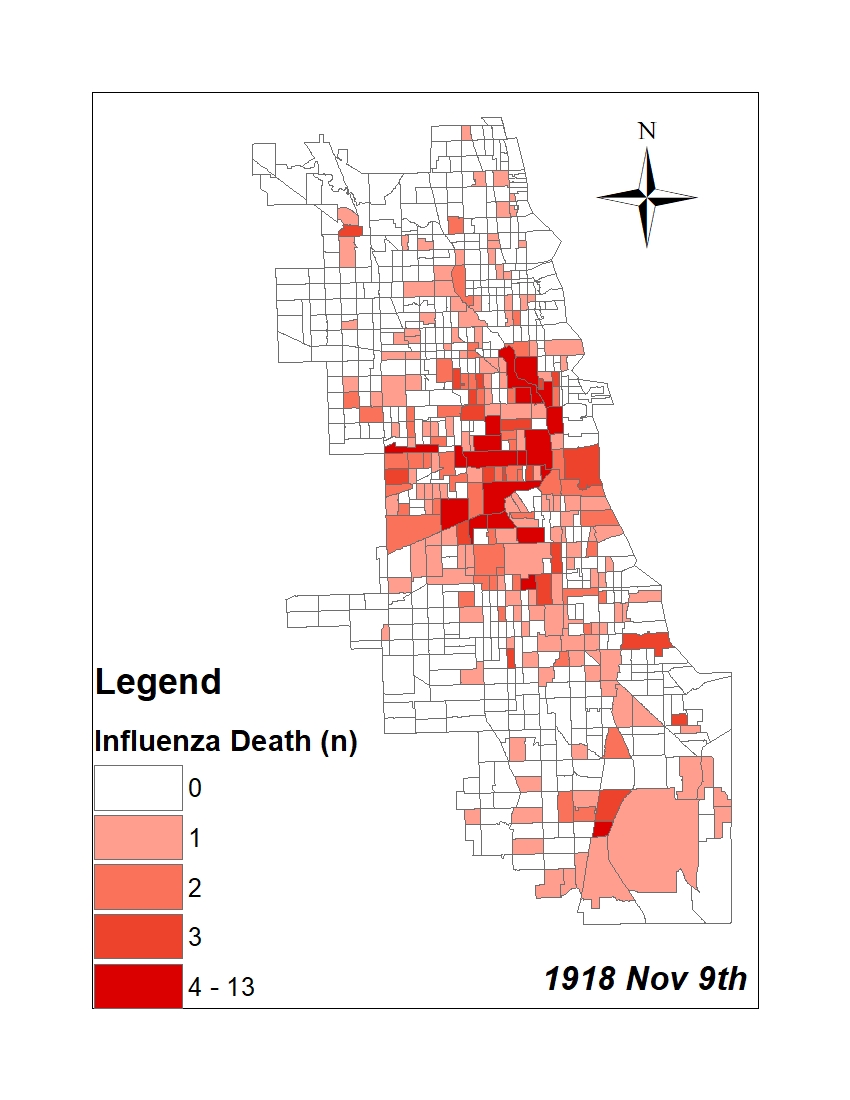
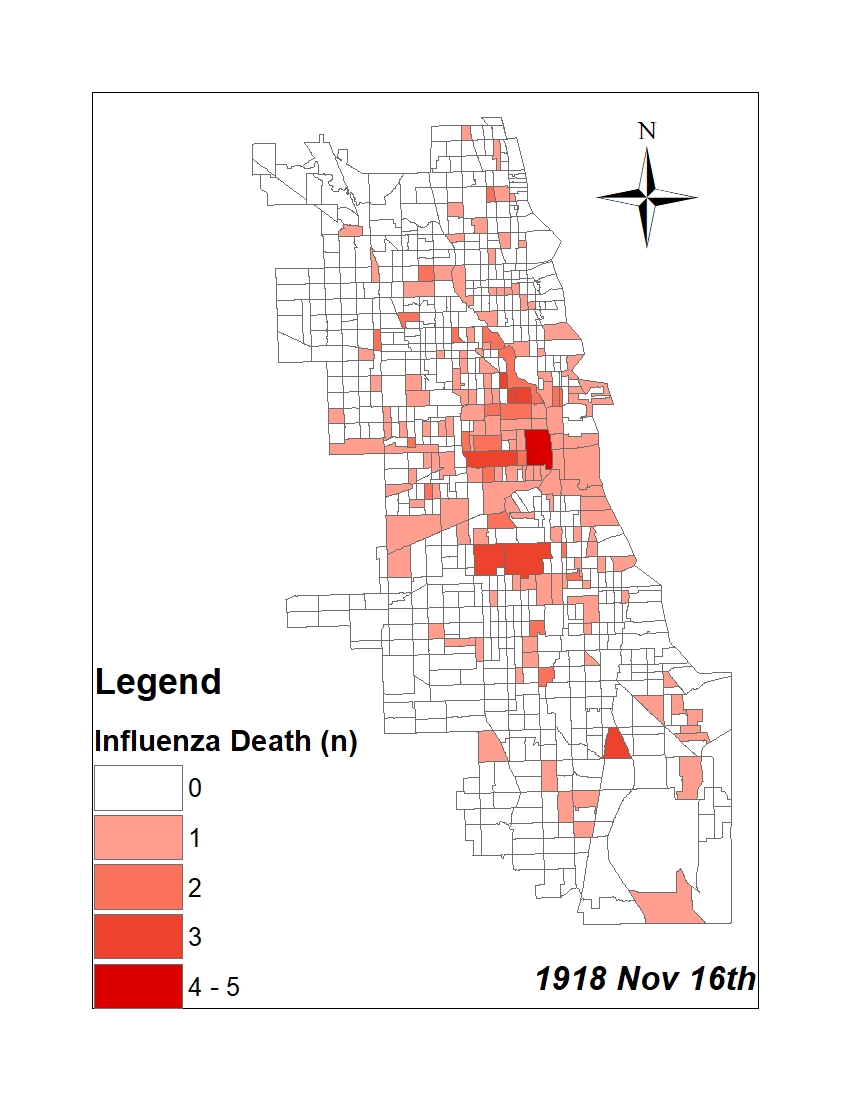
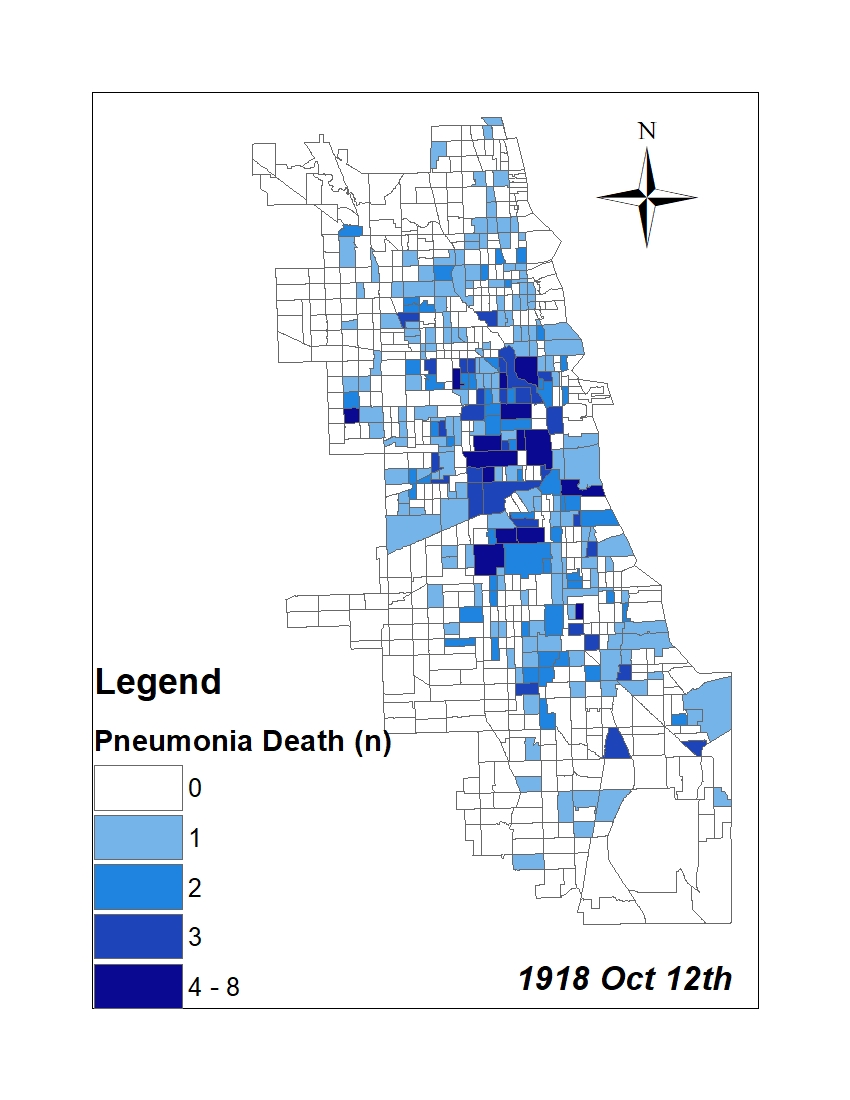
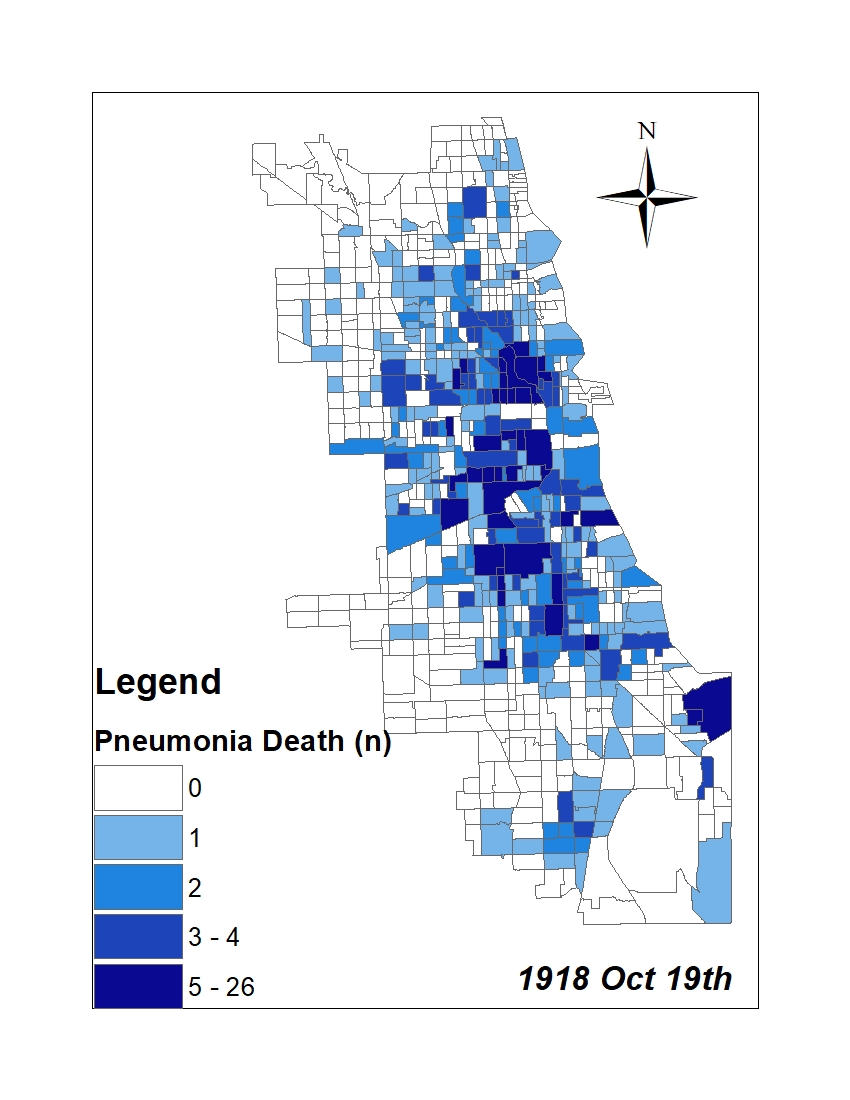
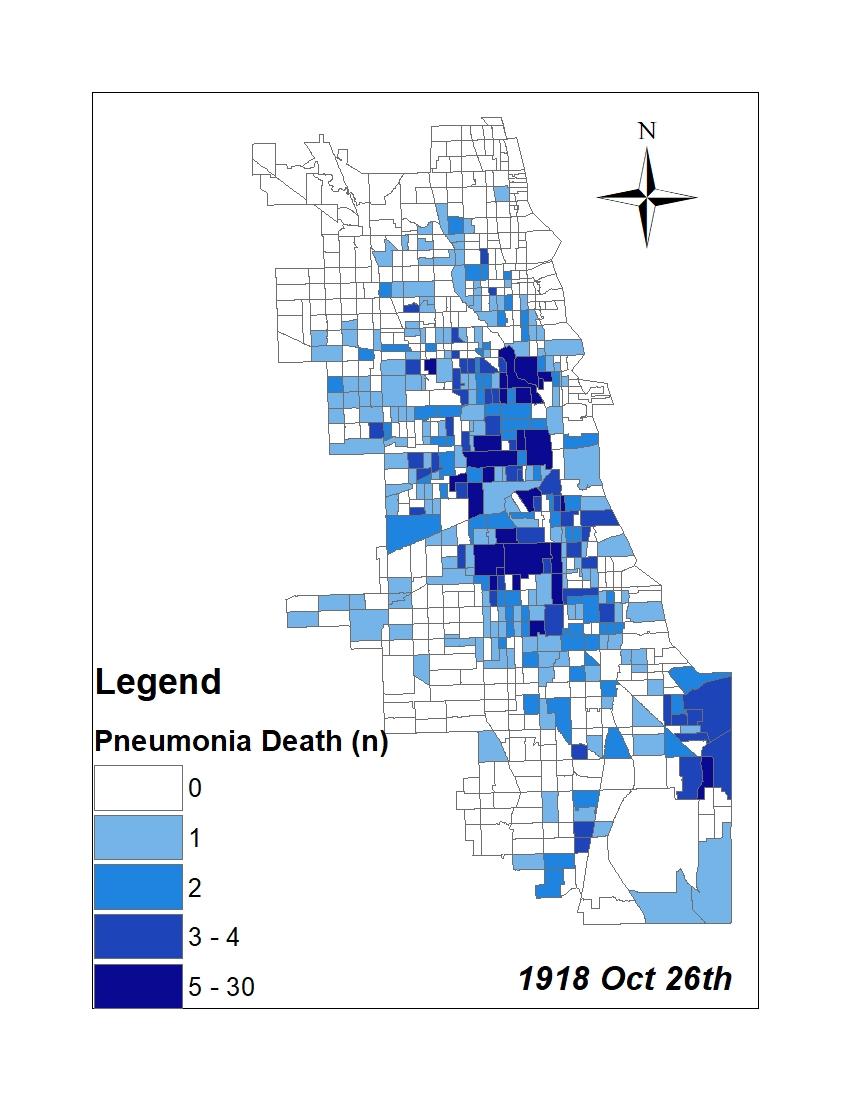
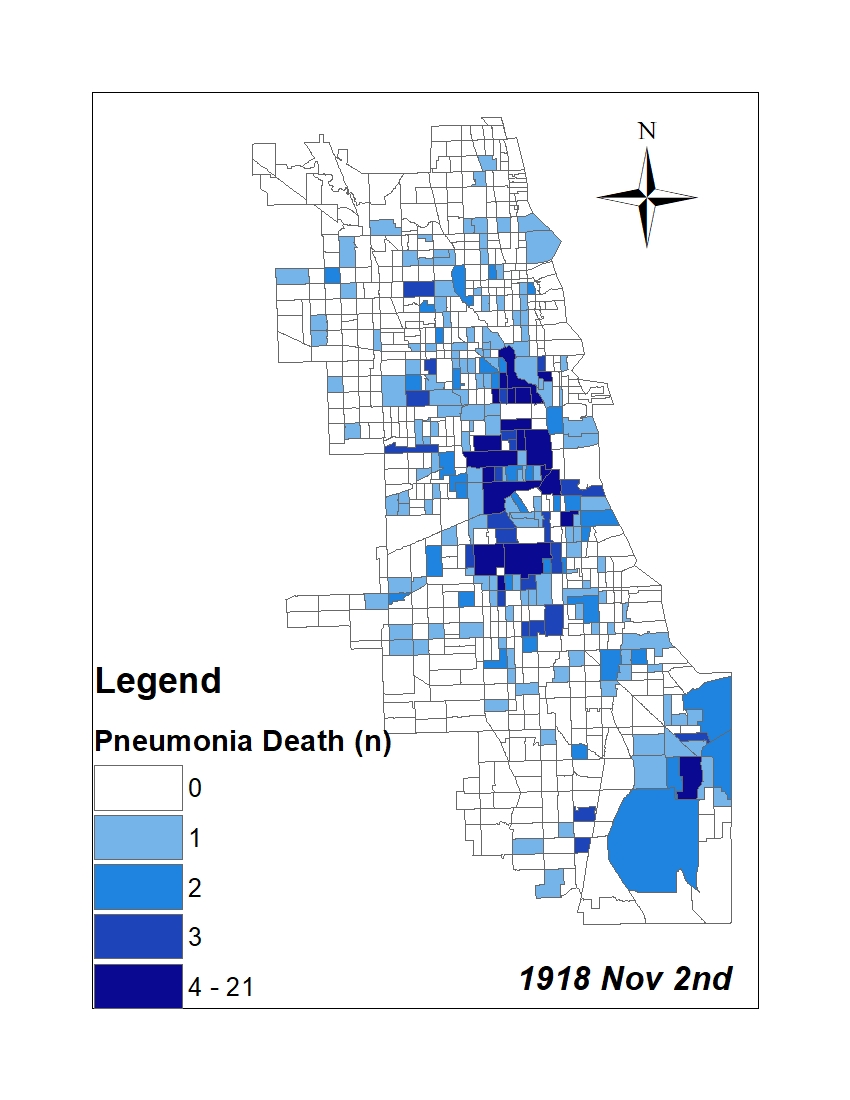
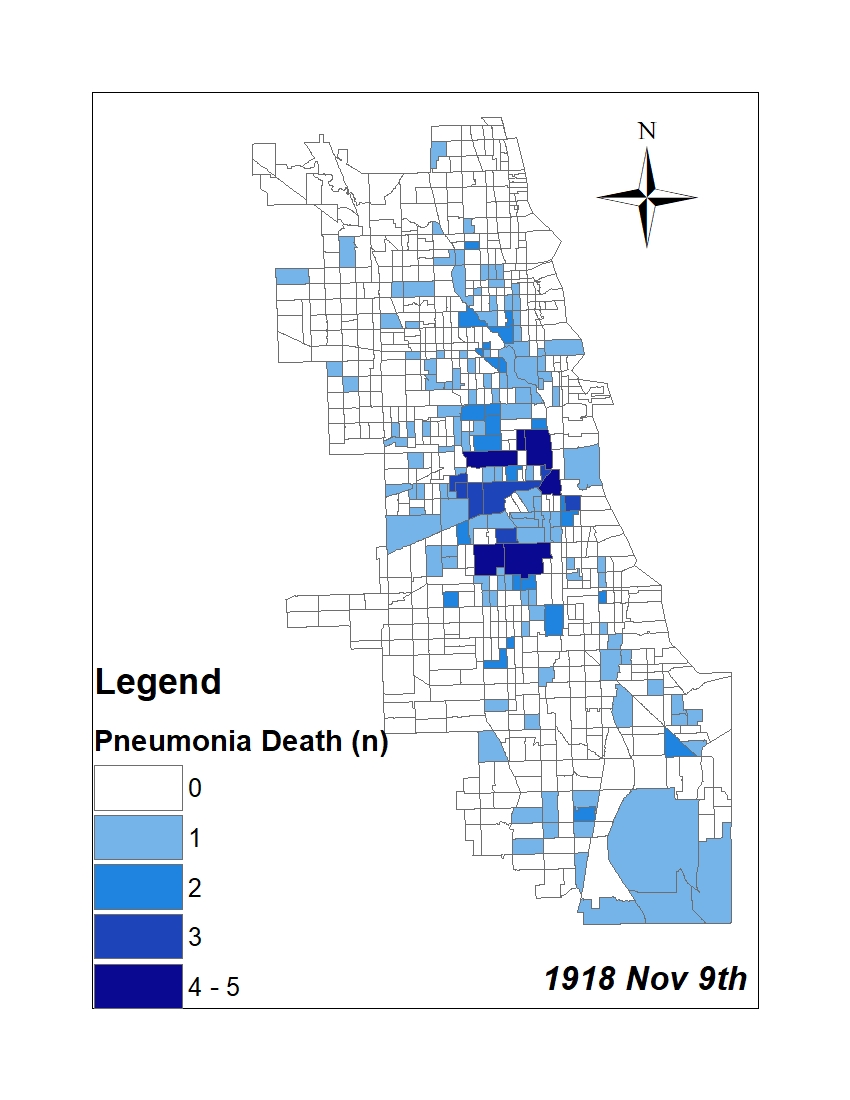
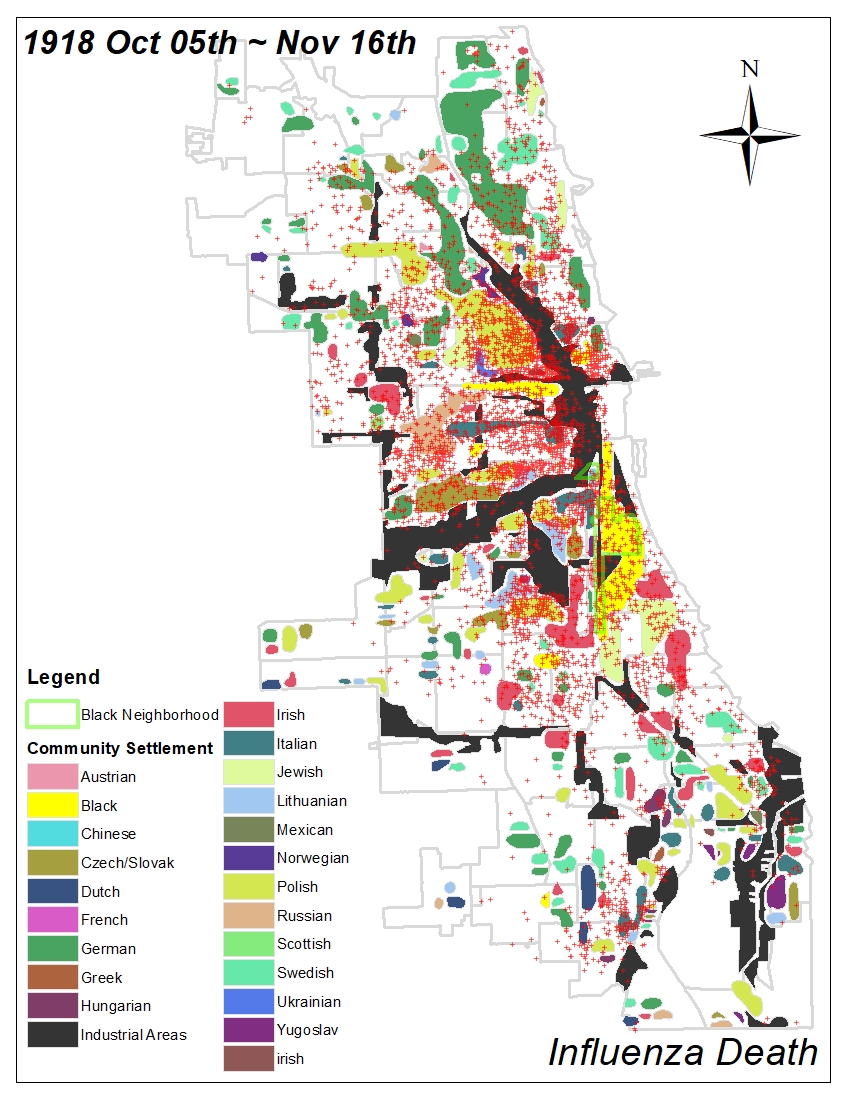
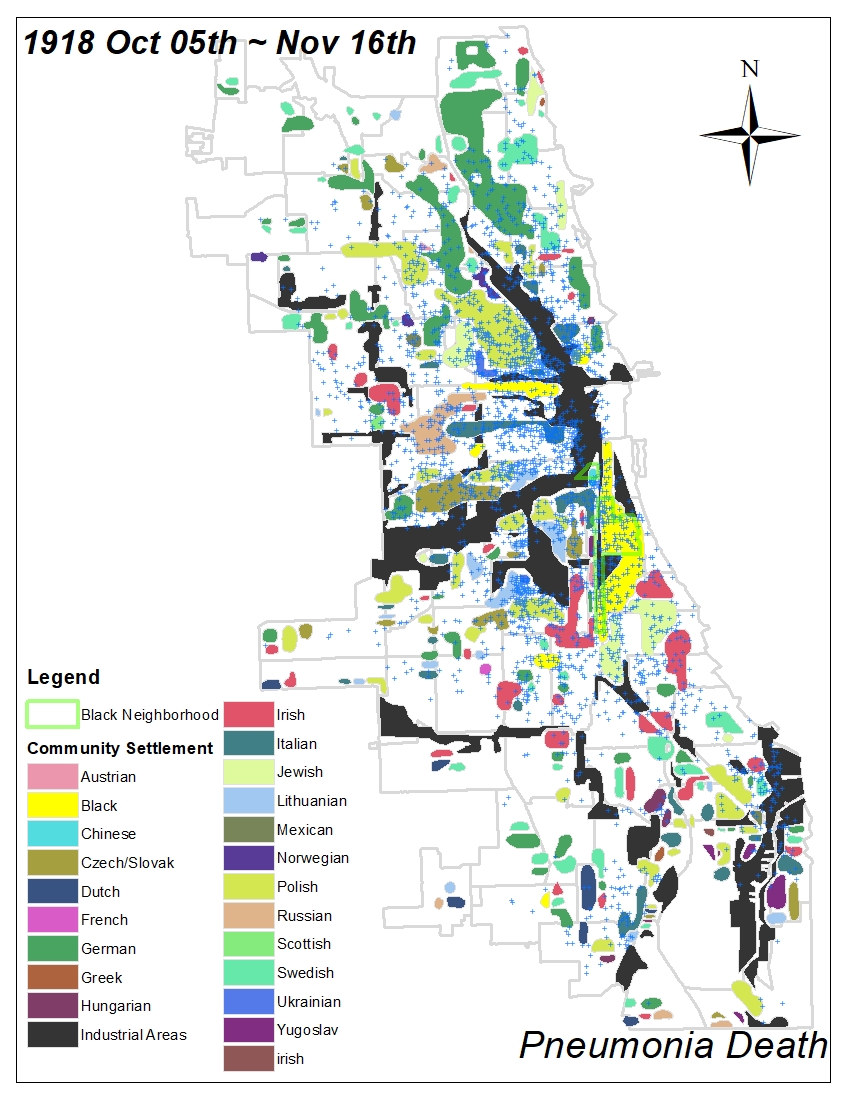
All historic maps that given geospatial/geolocation information were digitized and analyzed using ArcGIS software. To assess whether descendants of slaves and other Blacks living in Chicago were vulnerable to excess death during the 1918 Influenza Pandemic, data from the book, A Report of an Epidemic of Influenza in Chicago Occurring during the Fall of 1918, was digitized and analyzed. In the book are seven consecutive weekly maps of Chicago from the week ending on October 5th to the week ending on November 16th that illustrate the locations of influenza deaths and pneumonia deaths. Each point refers only to the location of death and not any description of the person who died.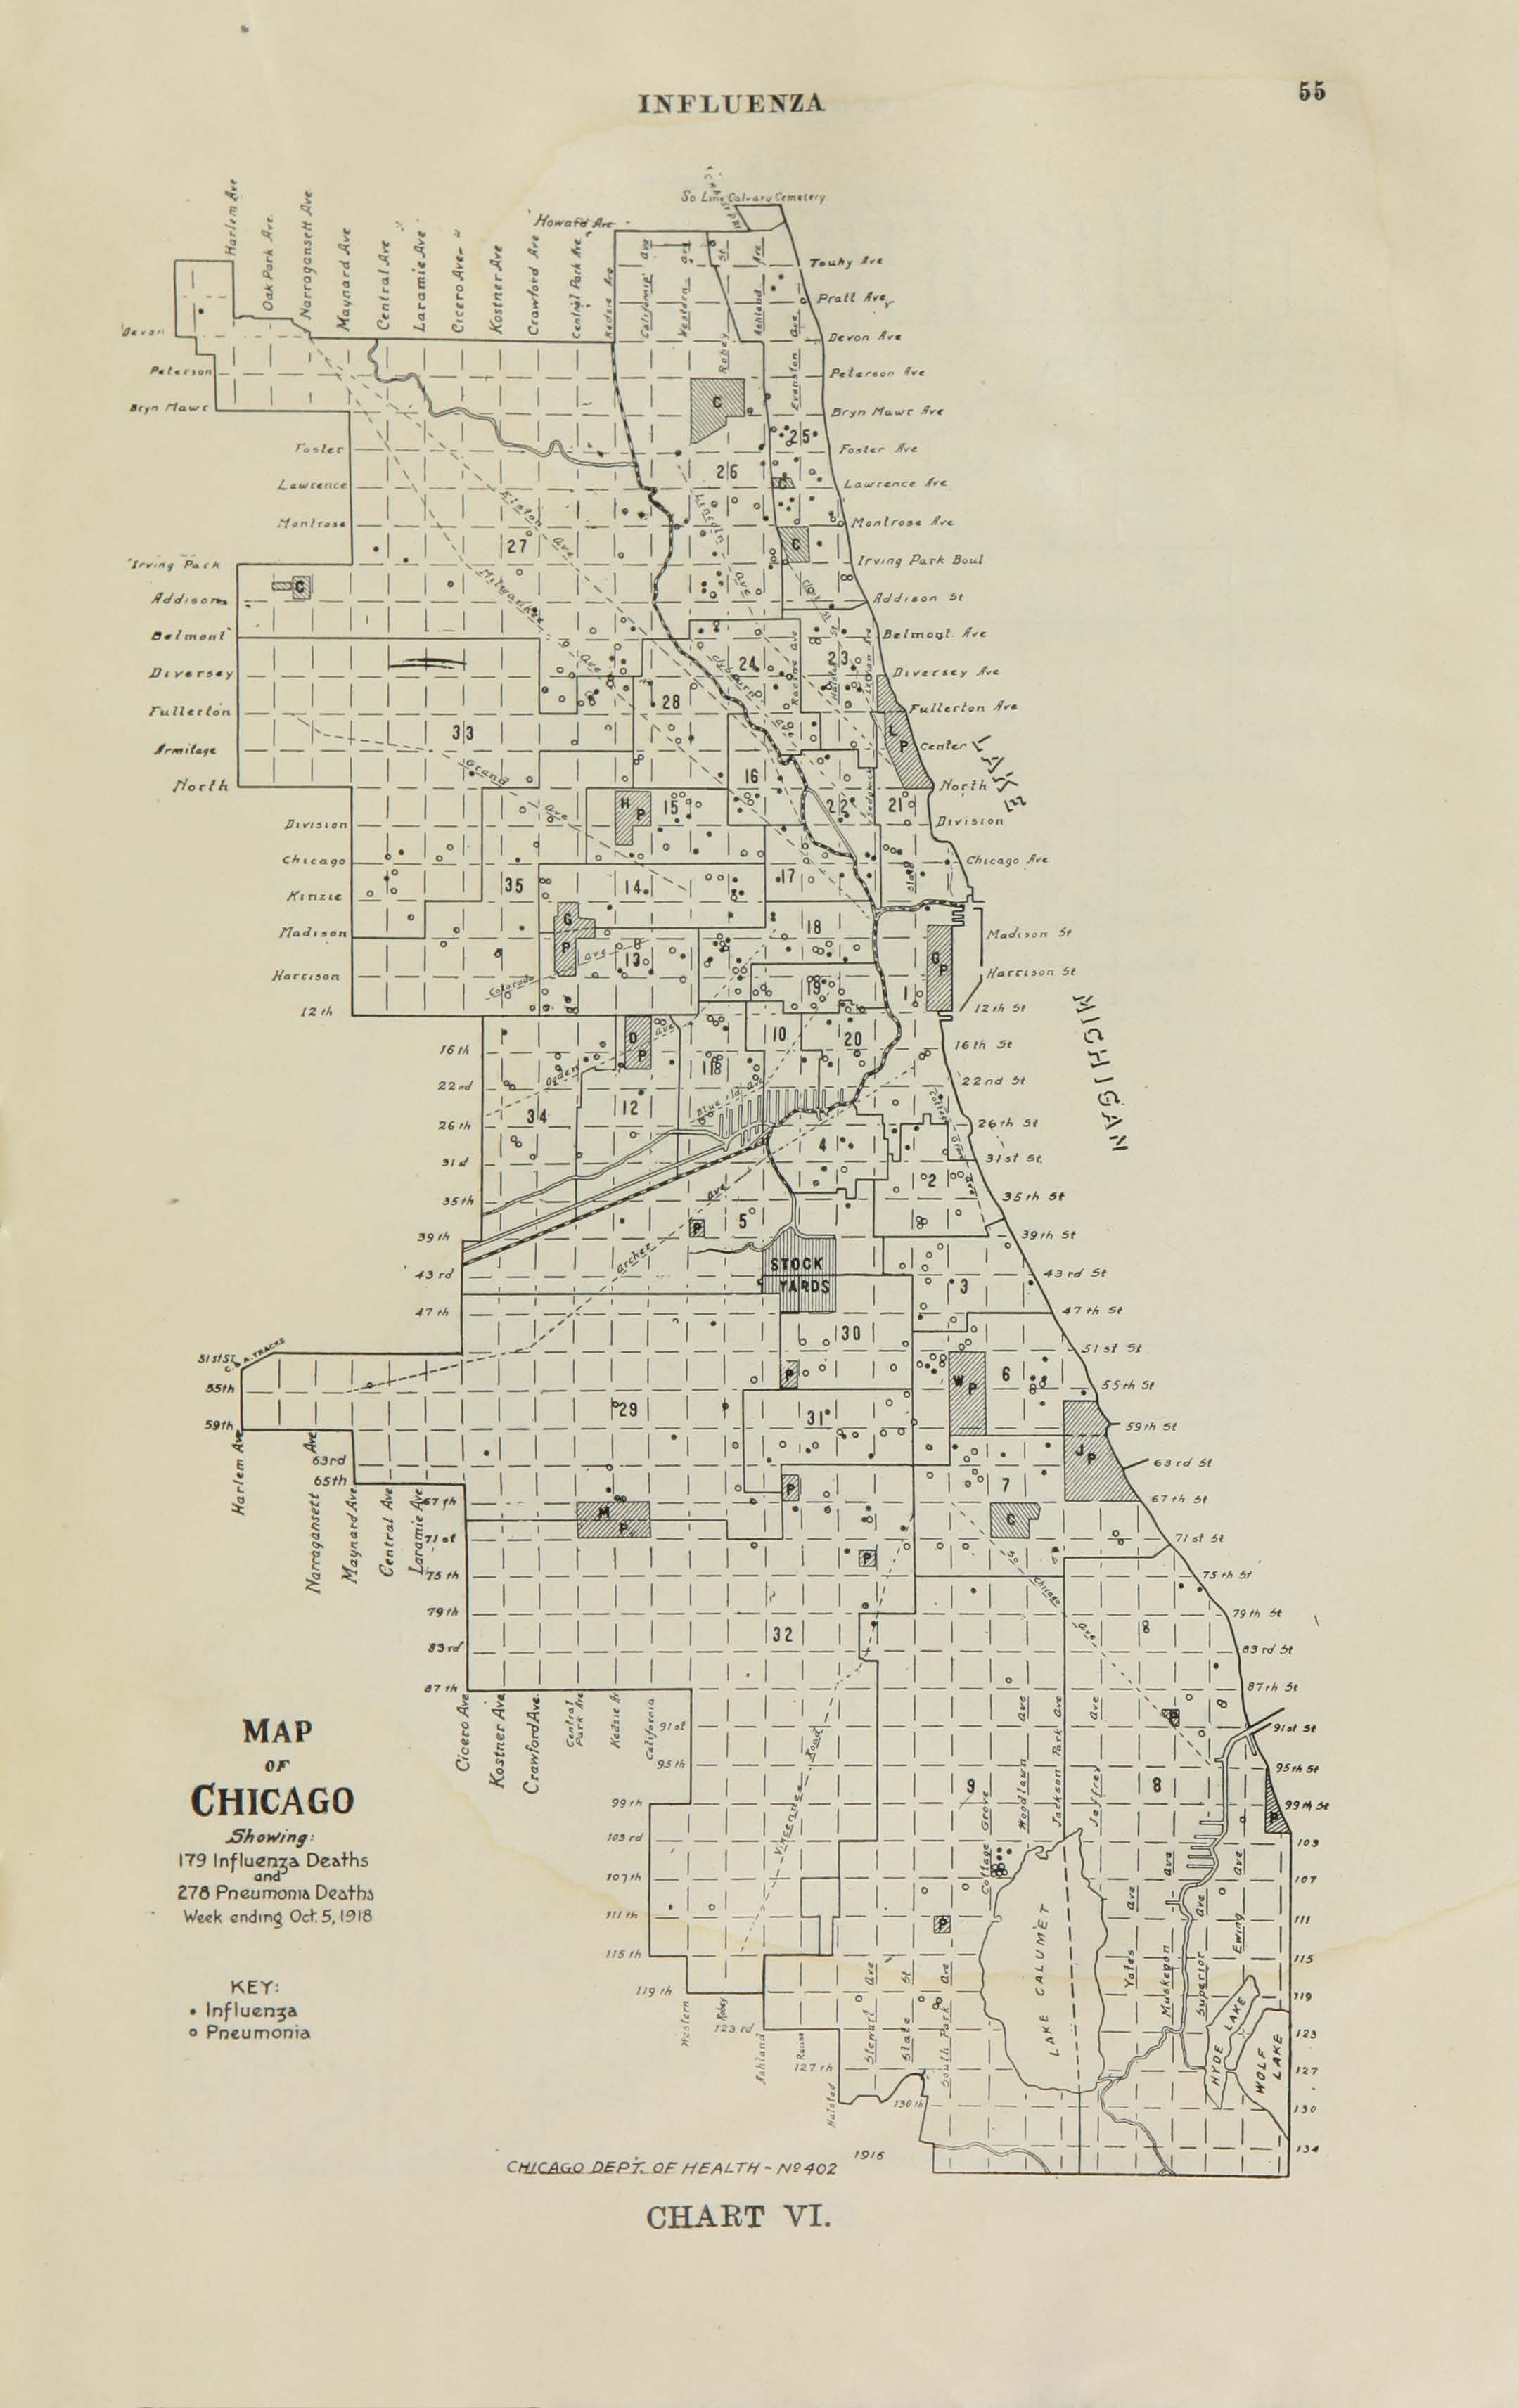
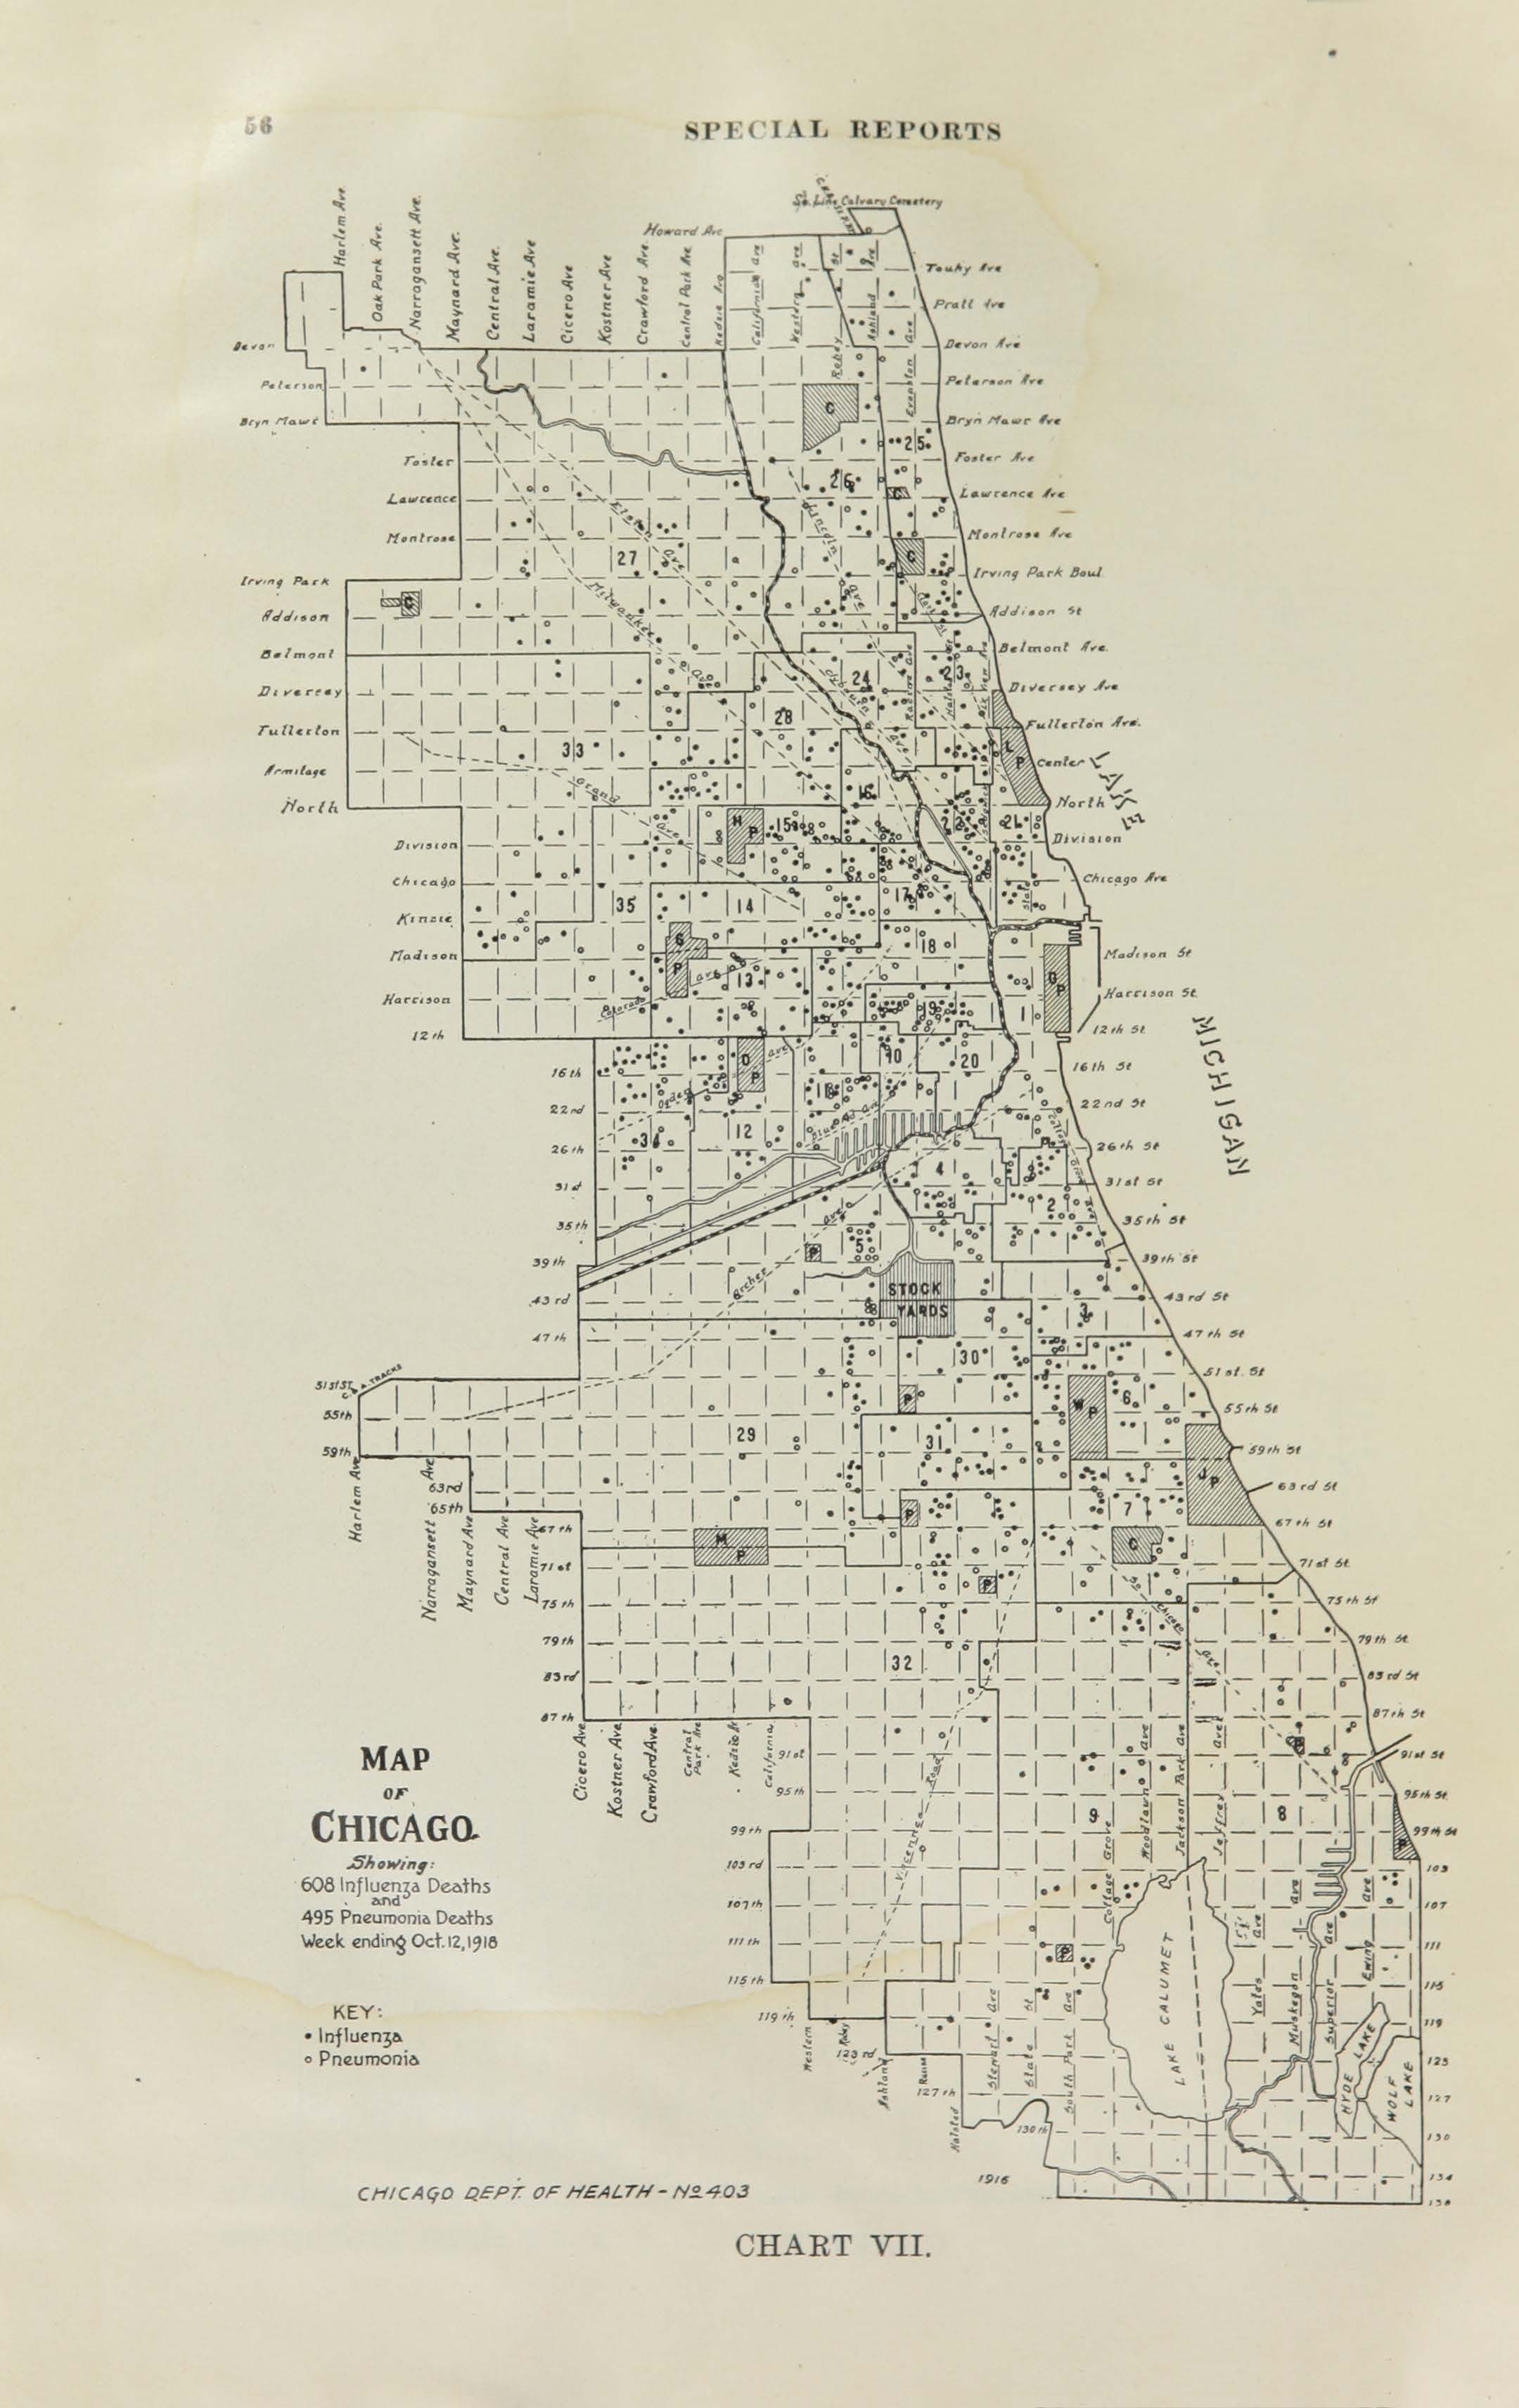
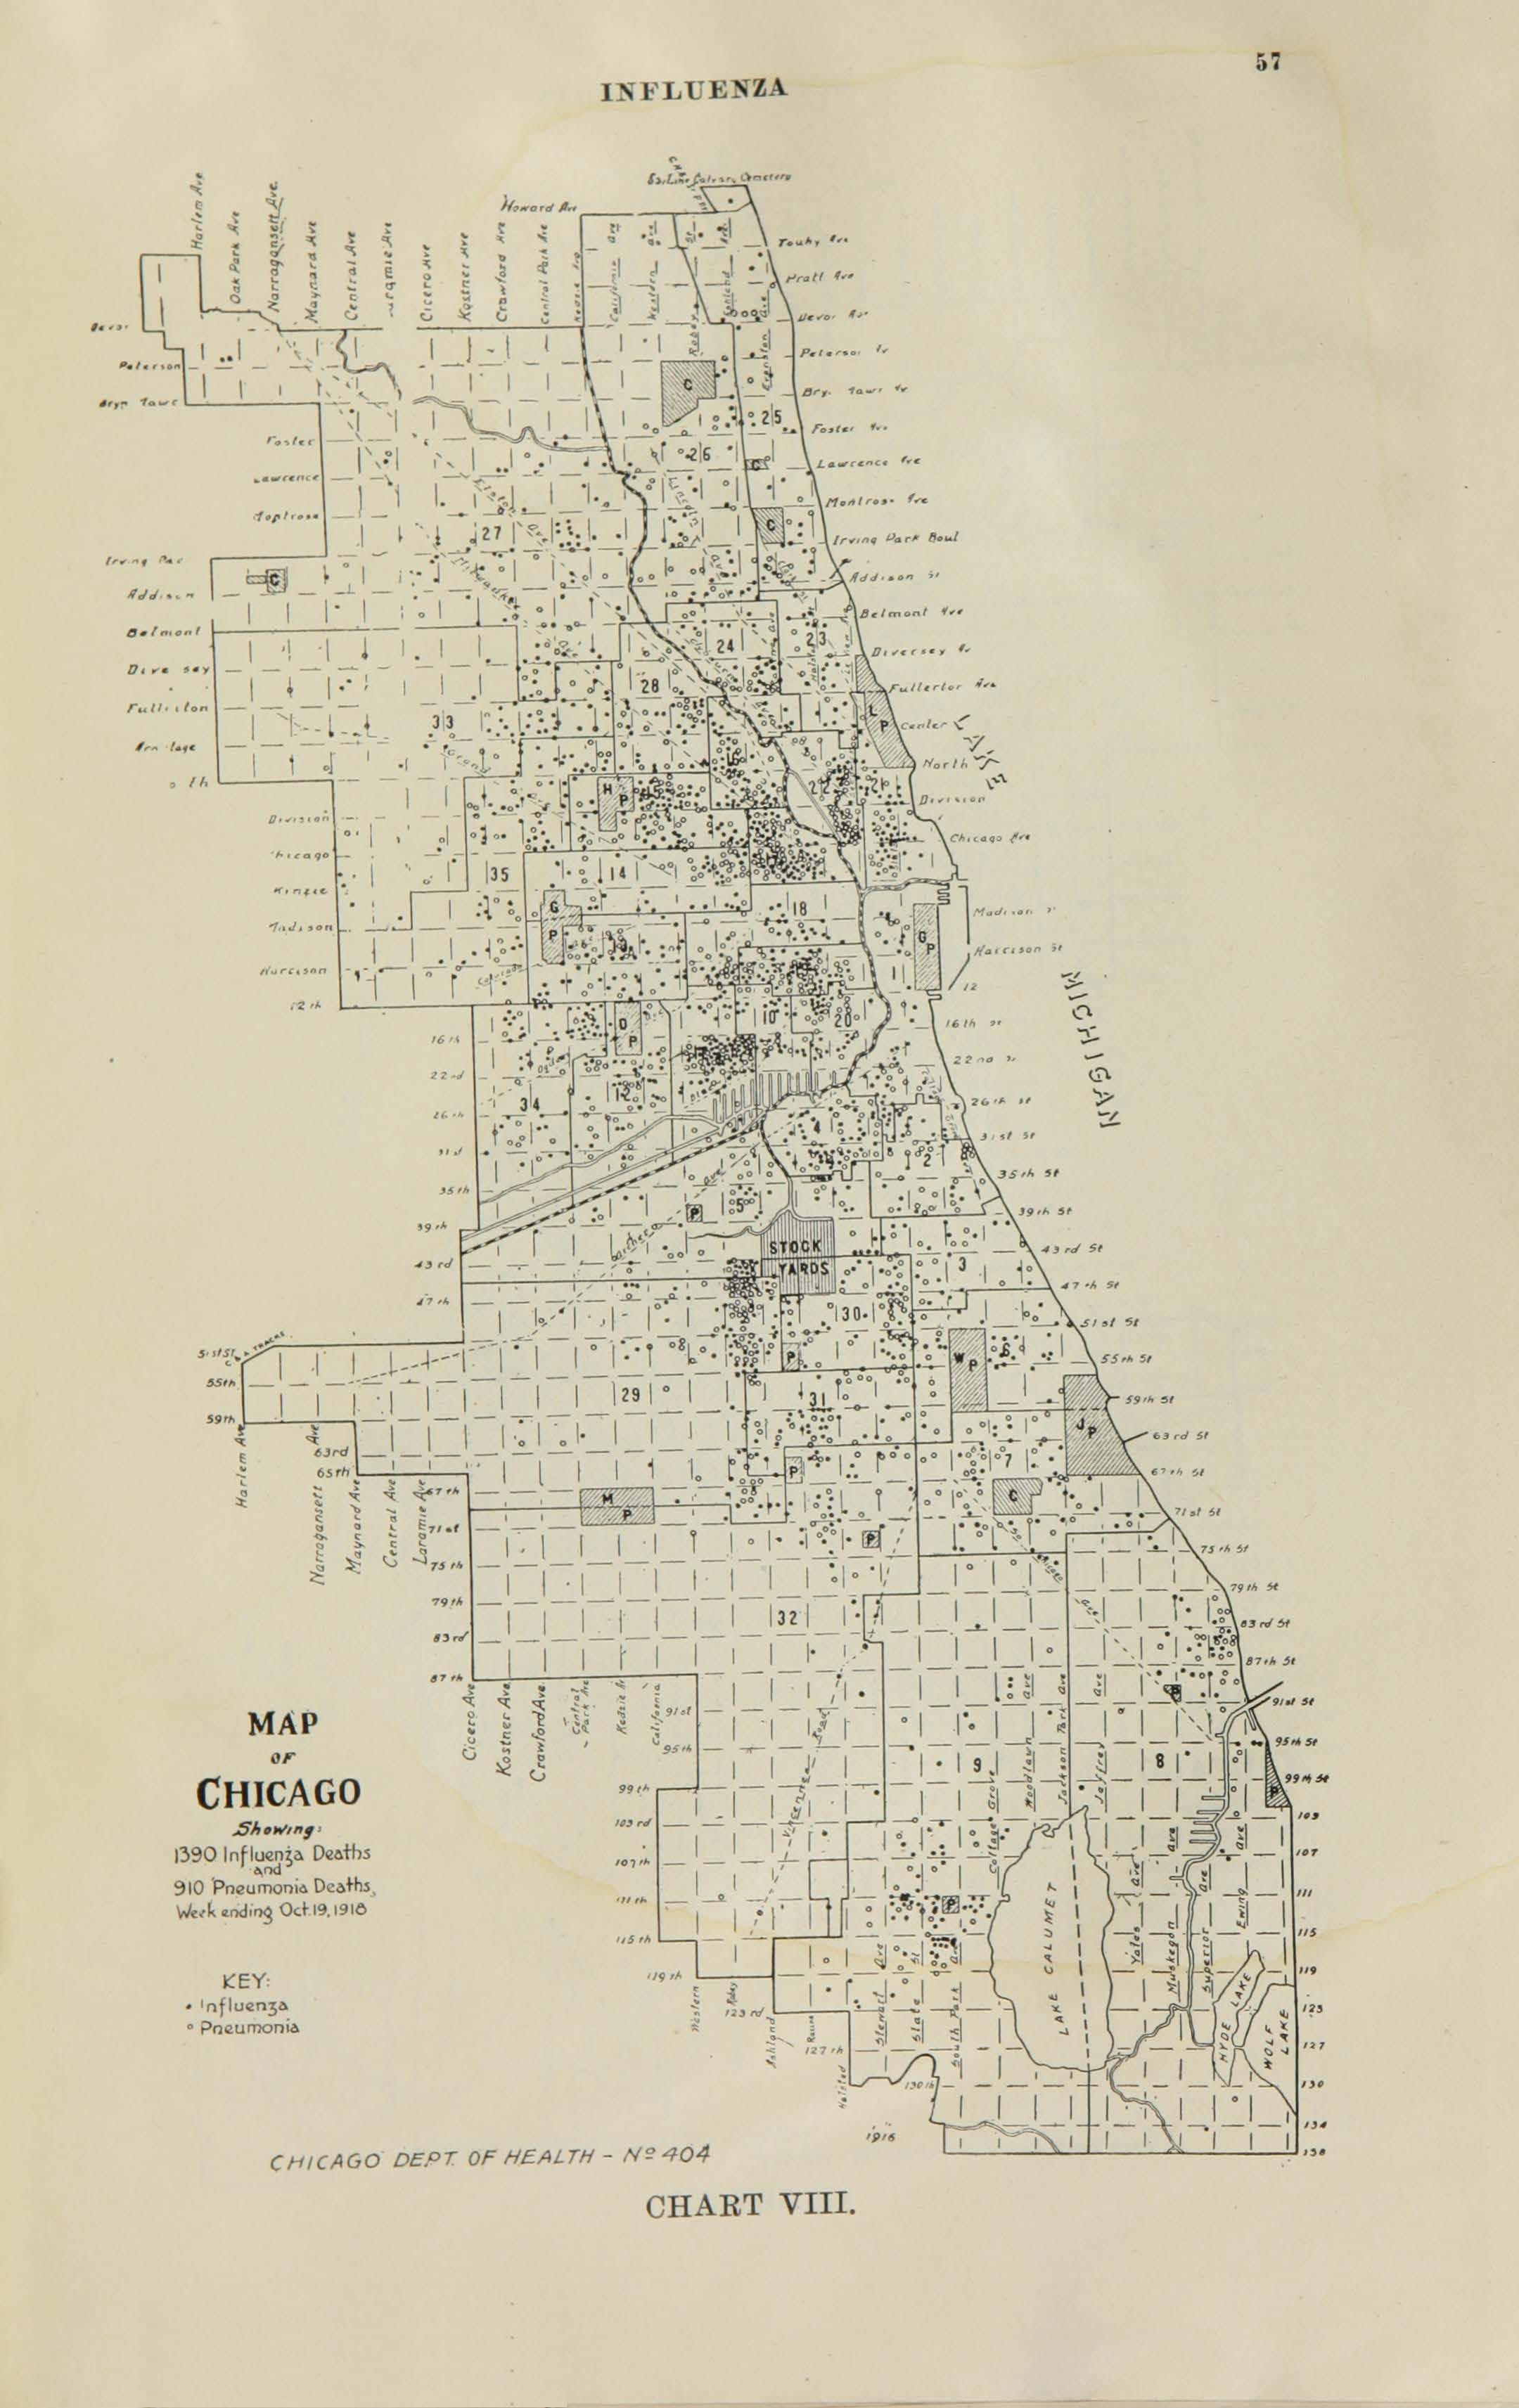
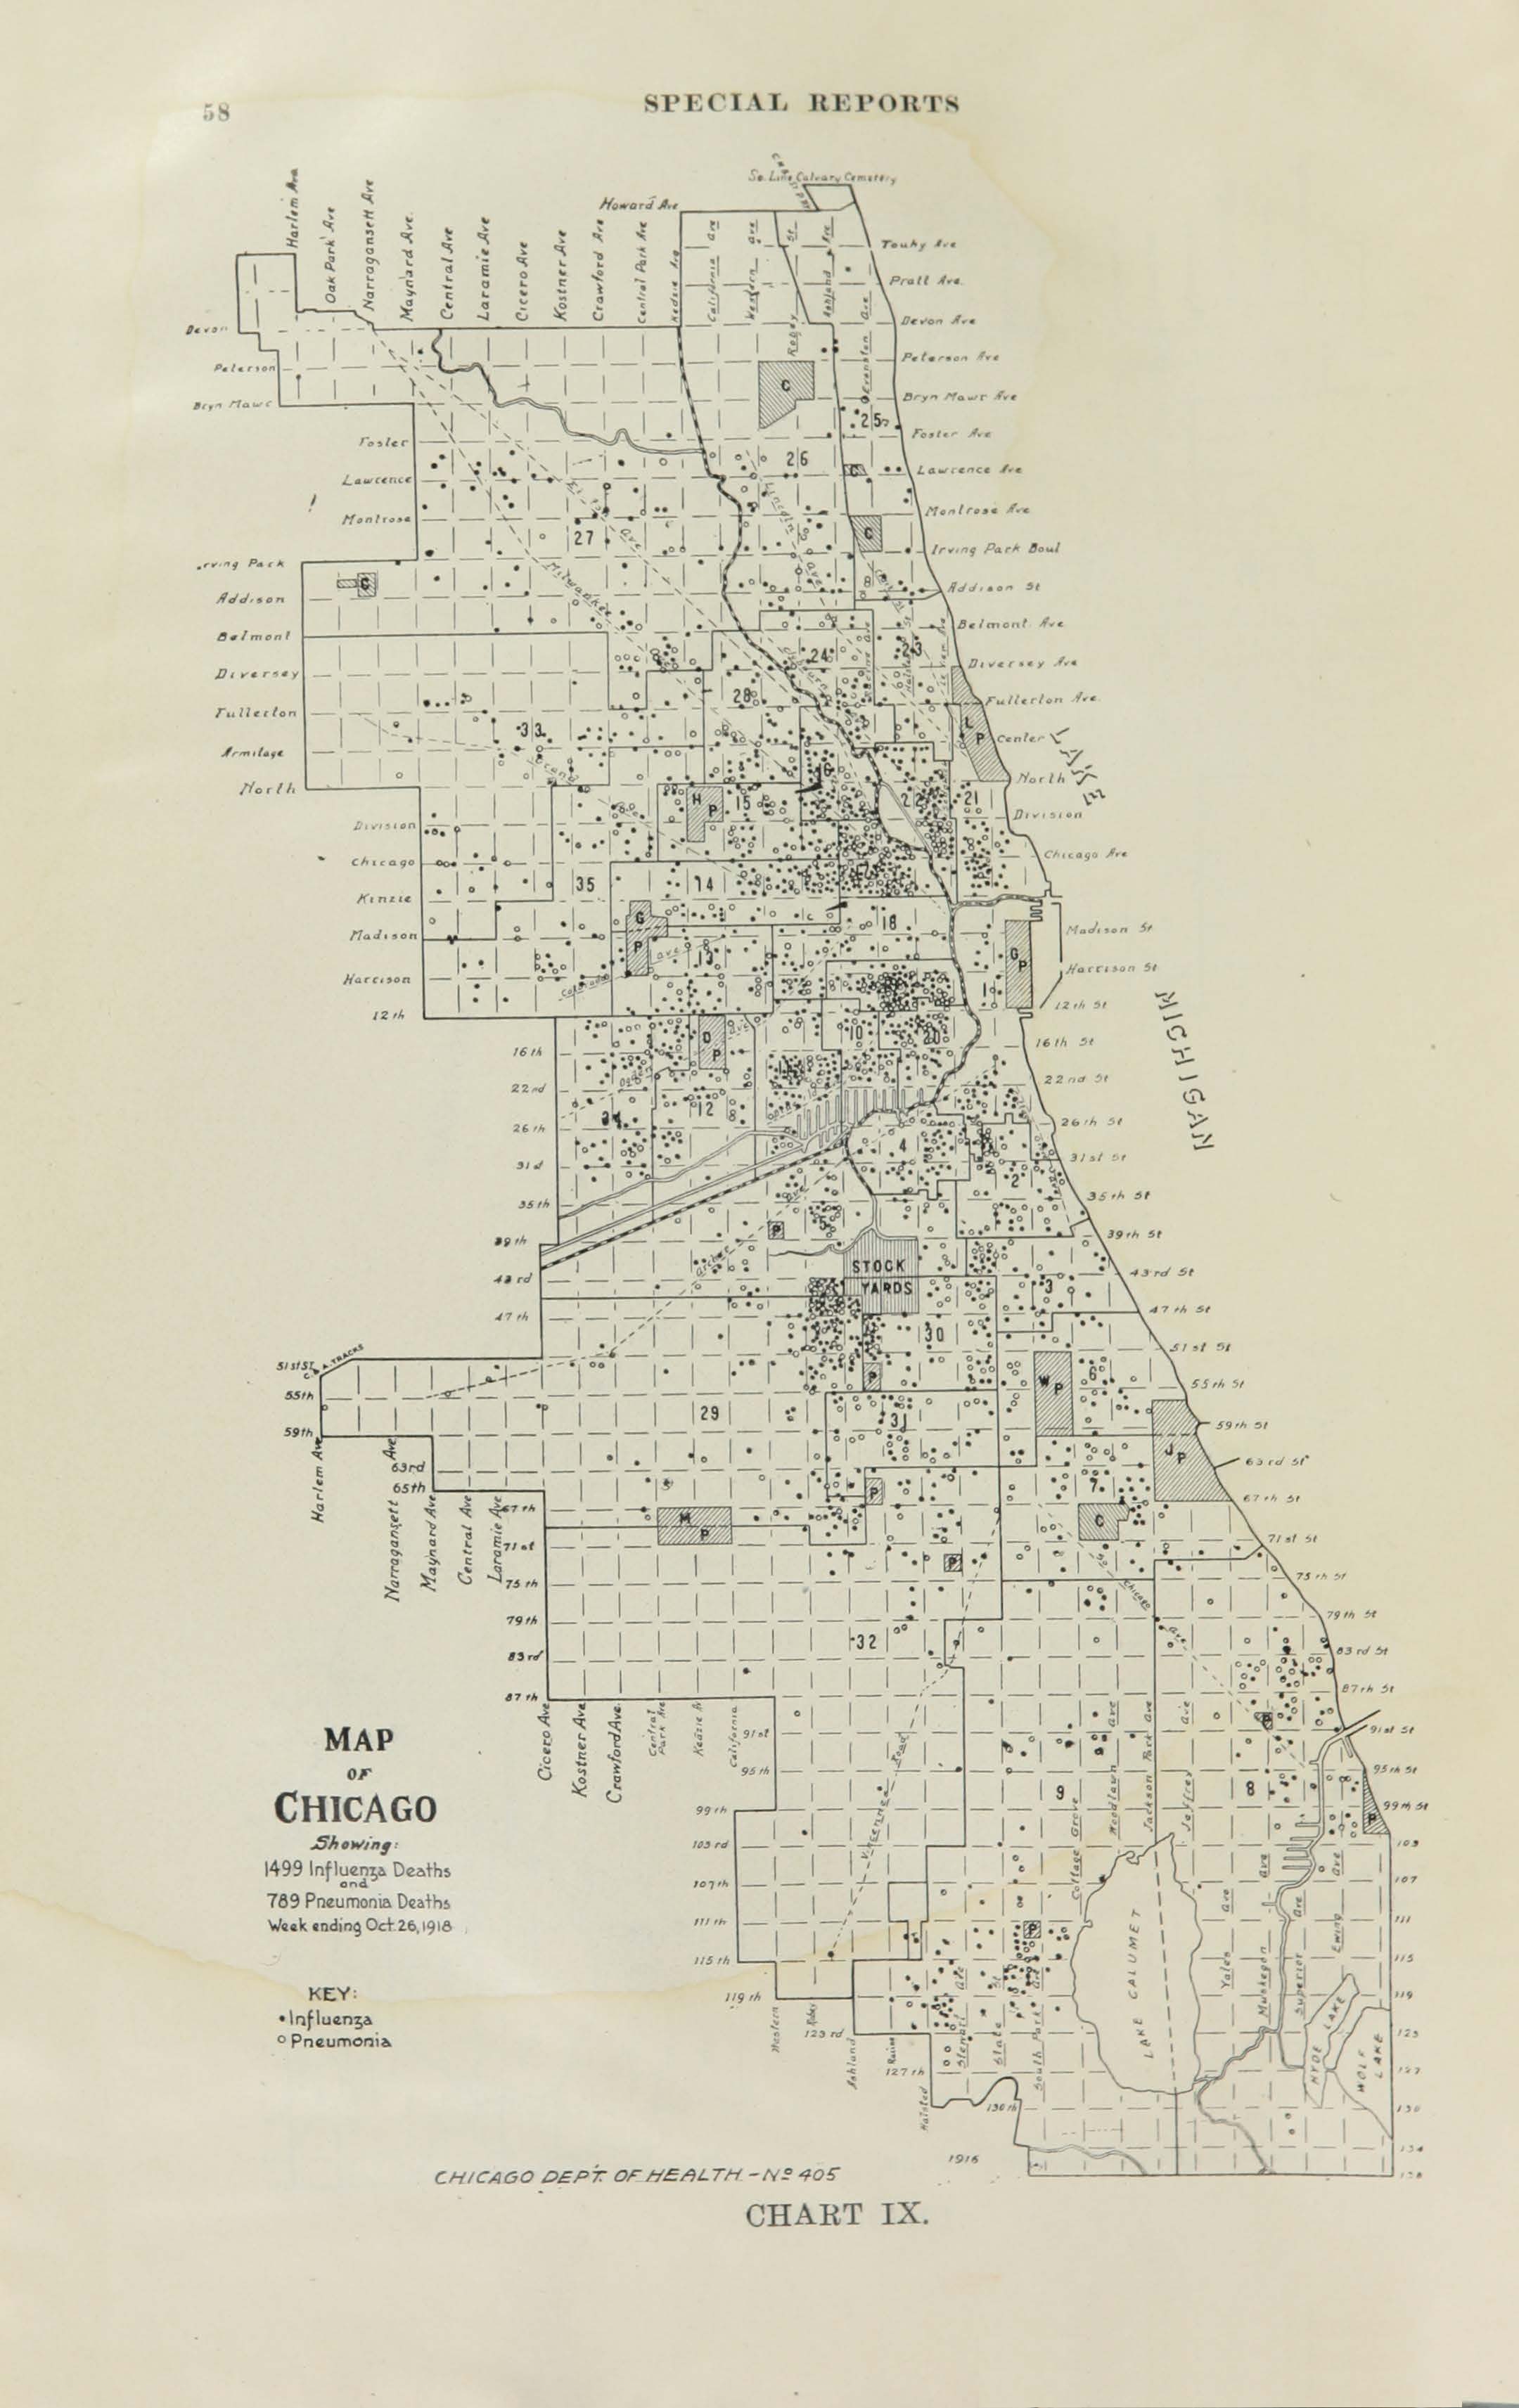
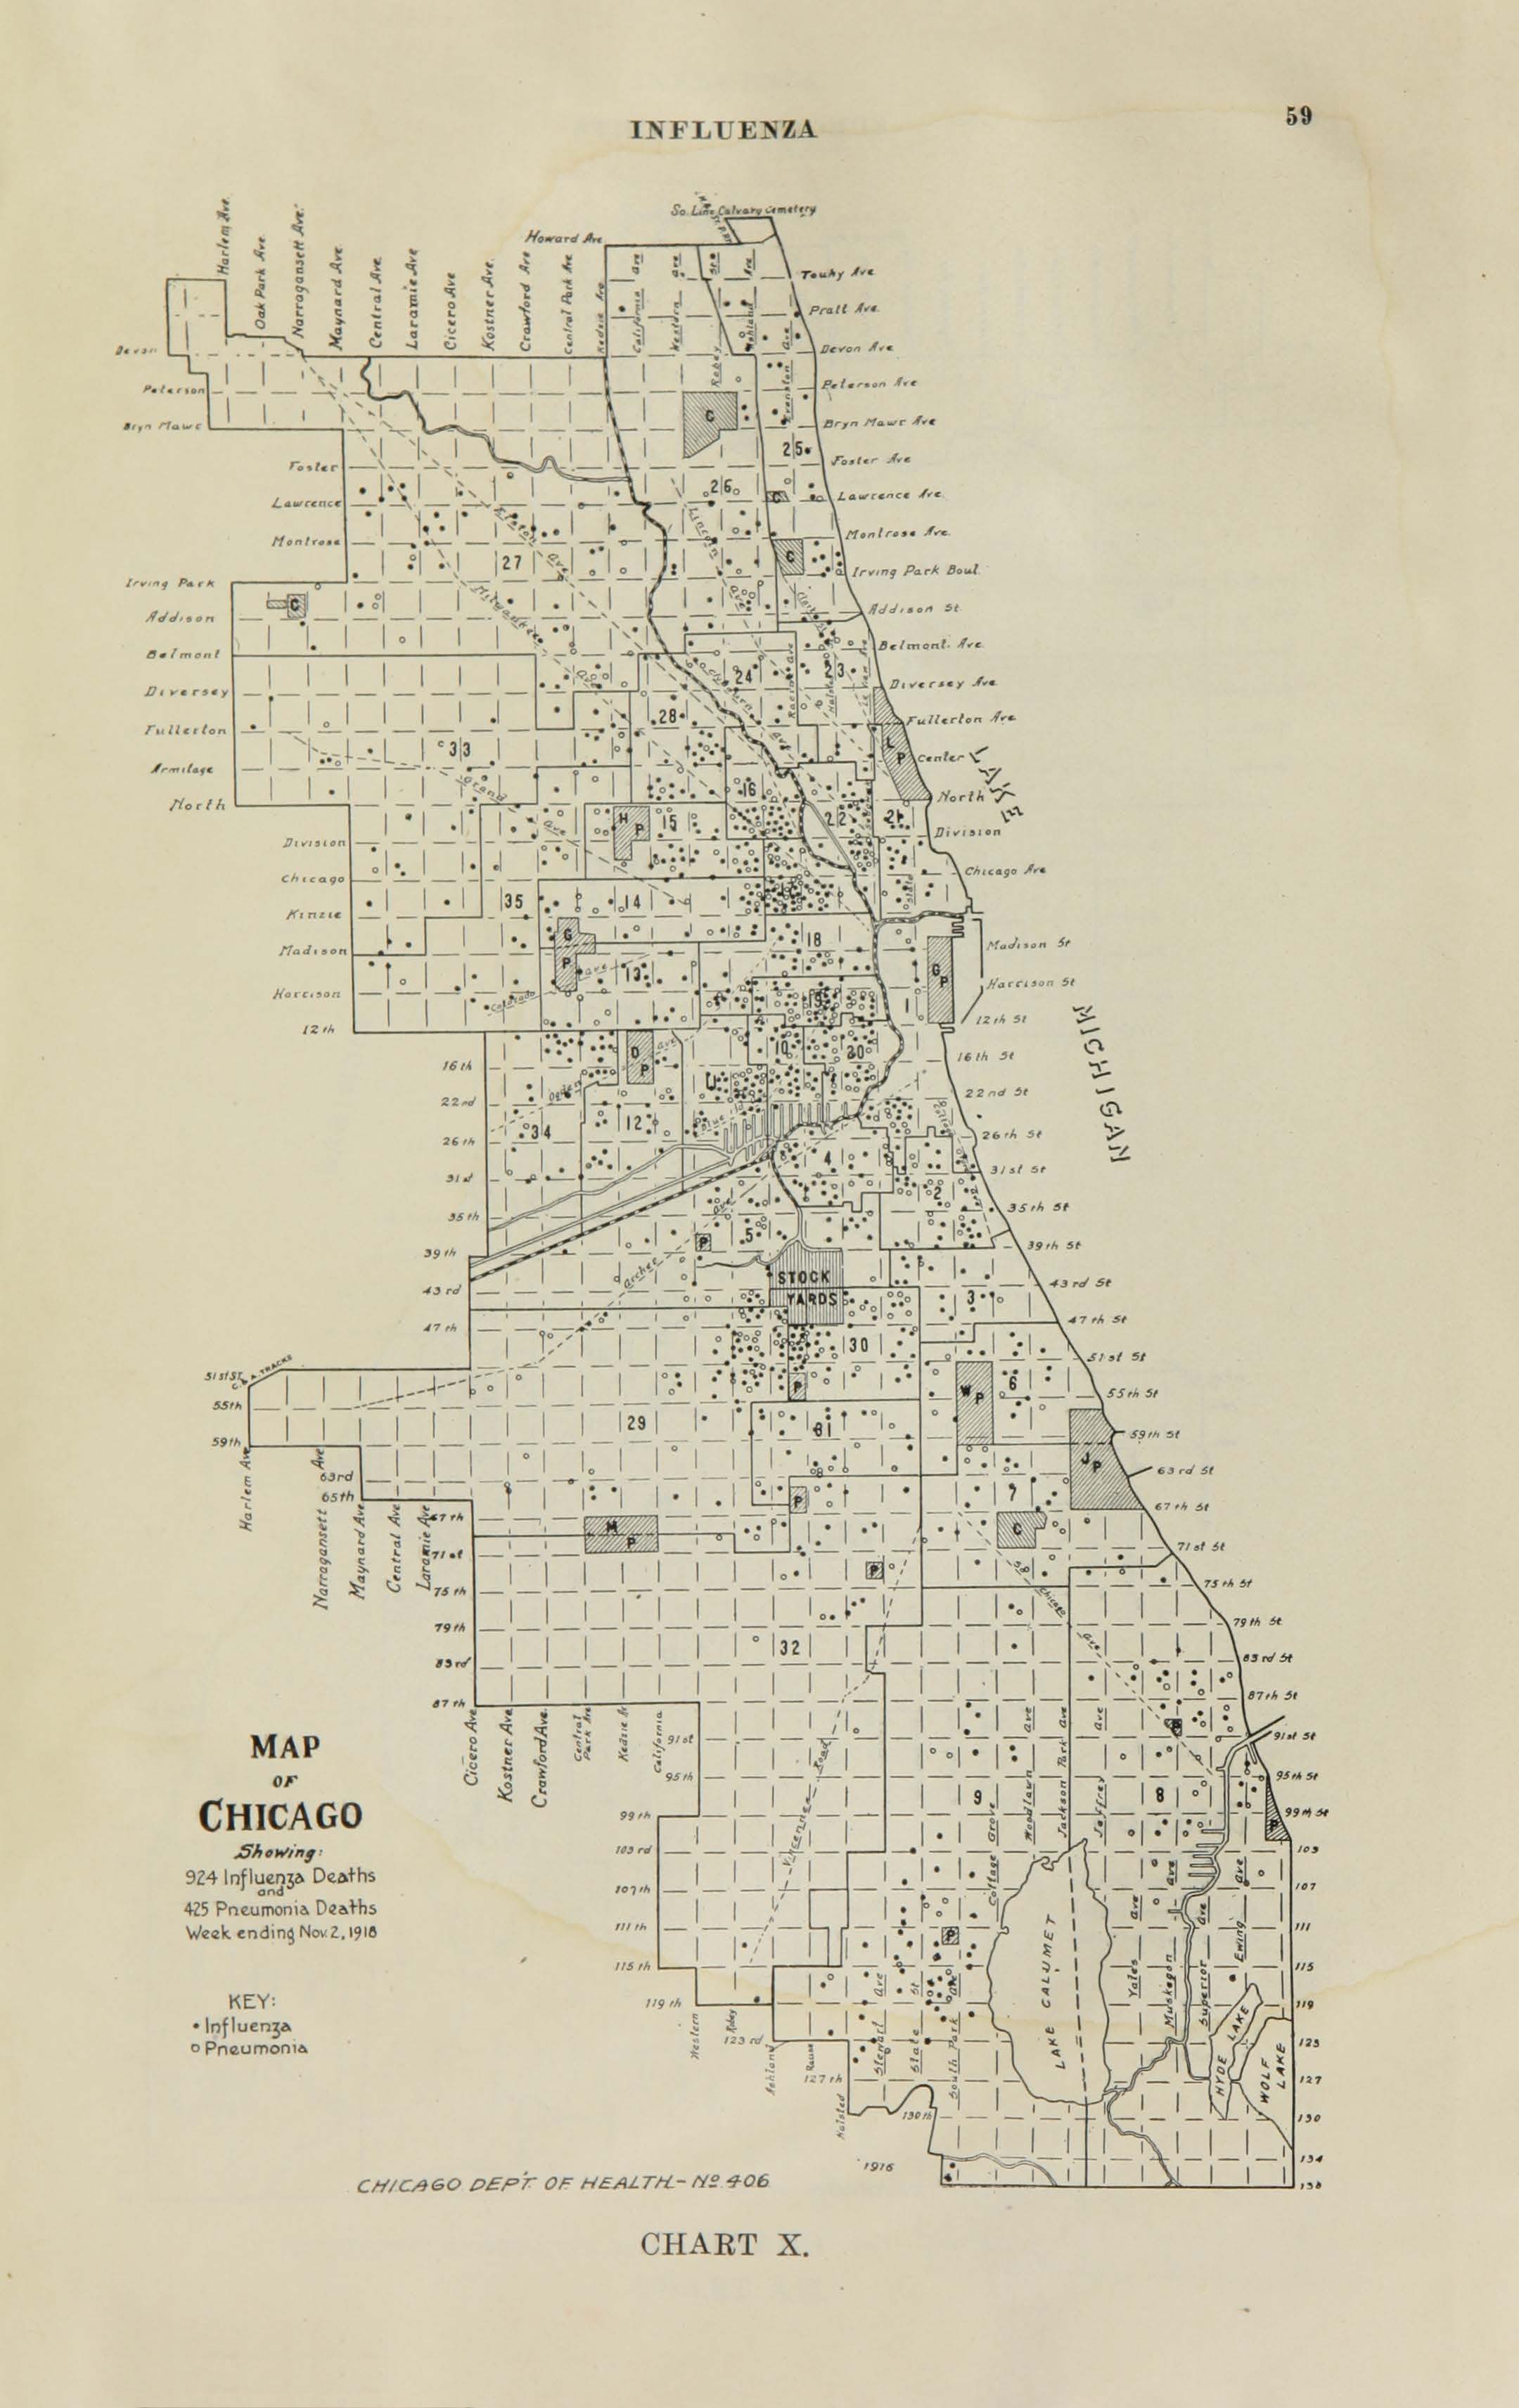
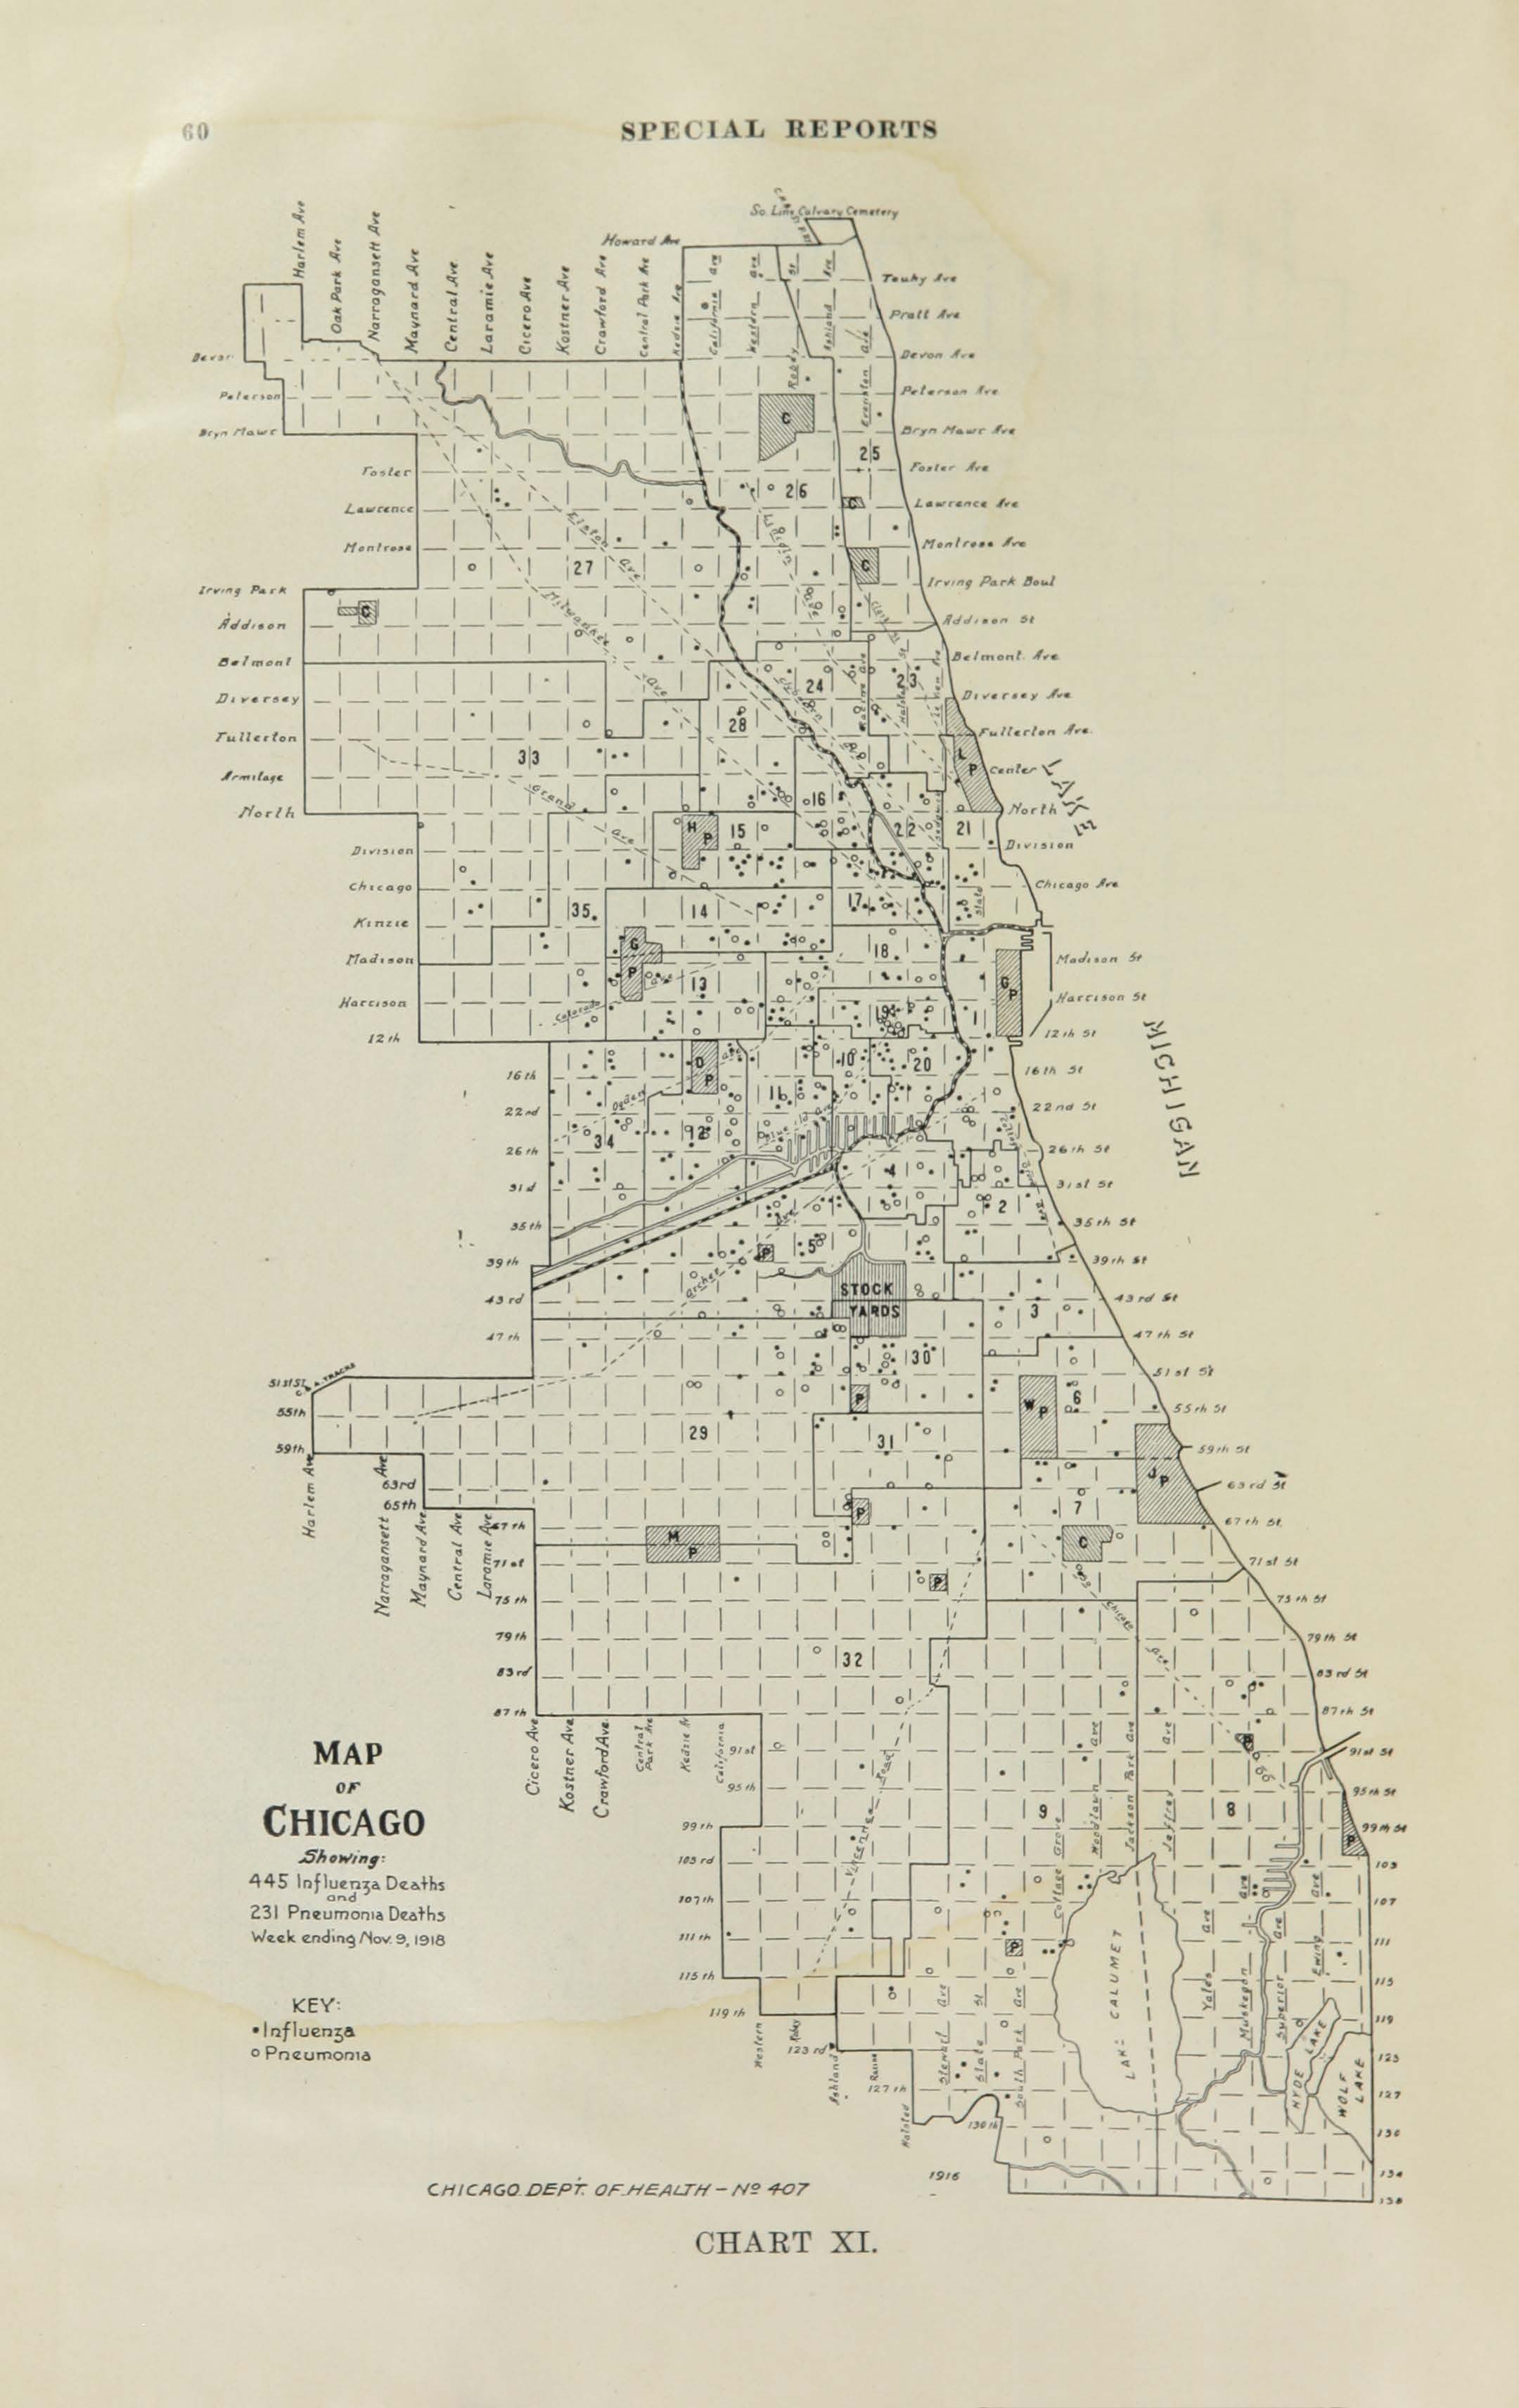
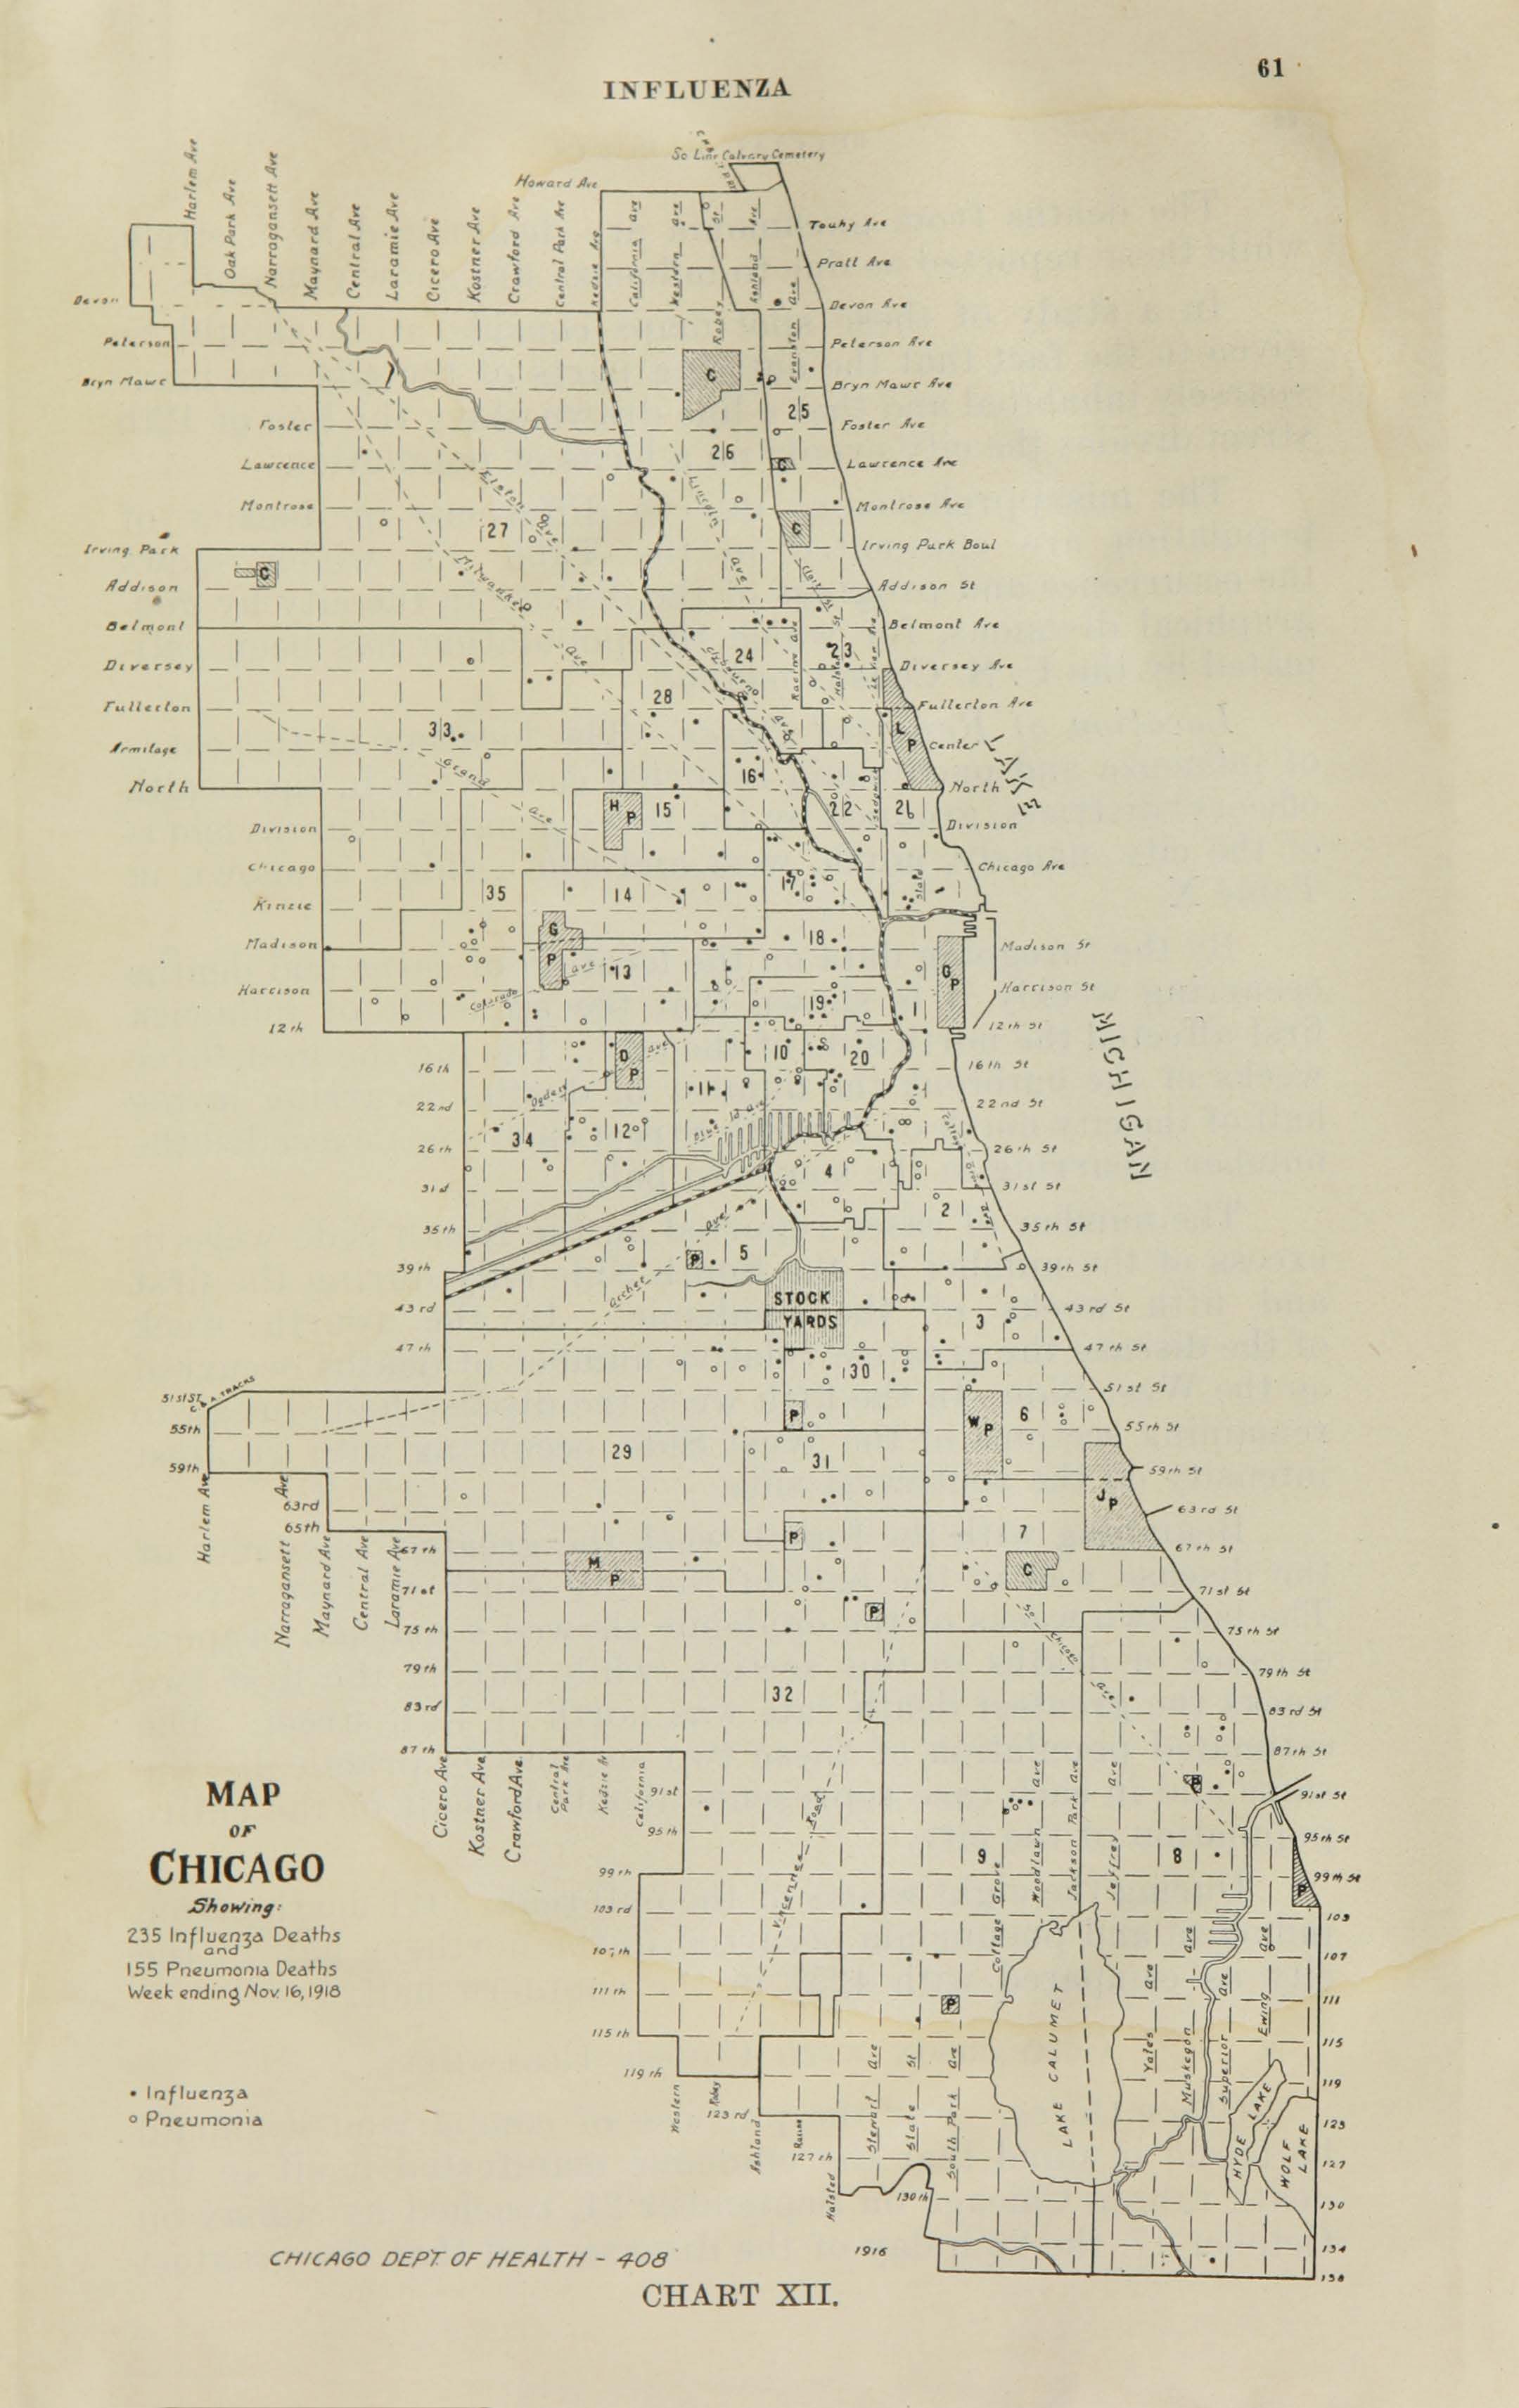
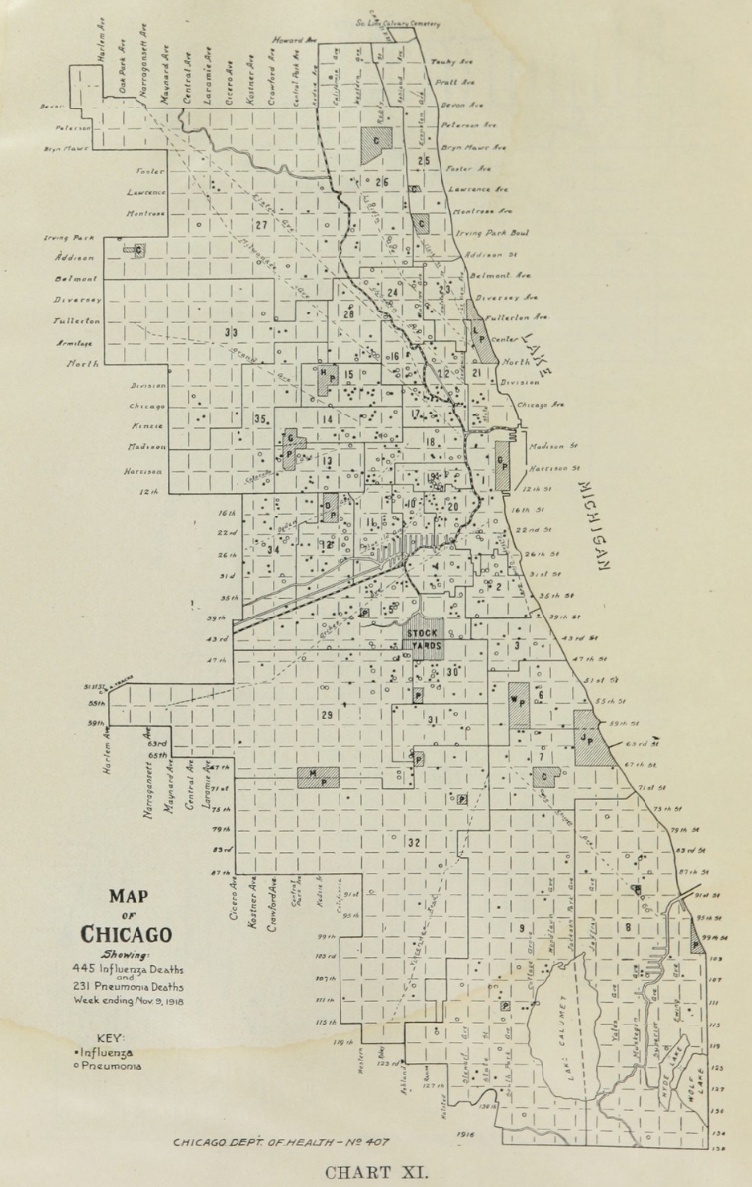
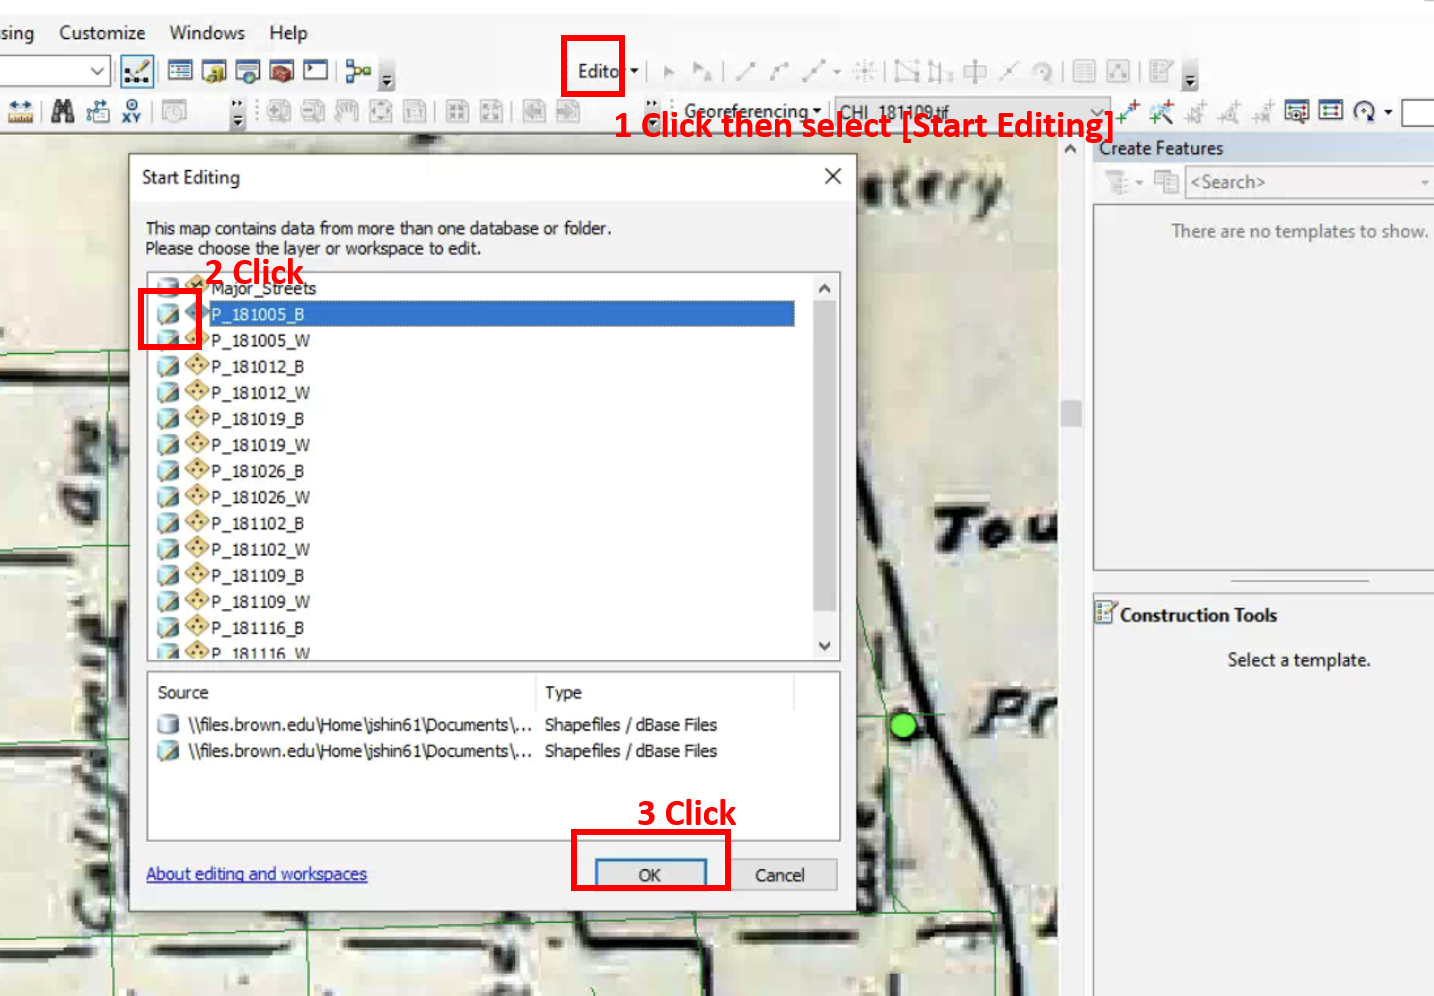
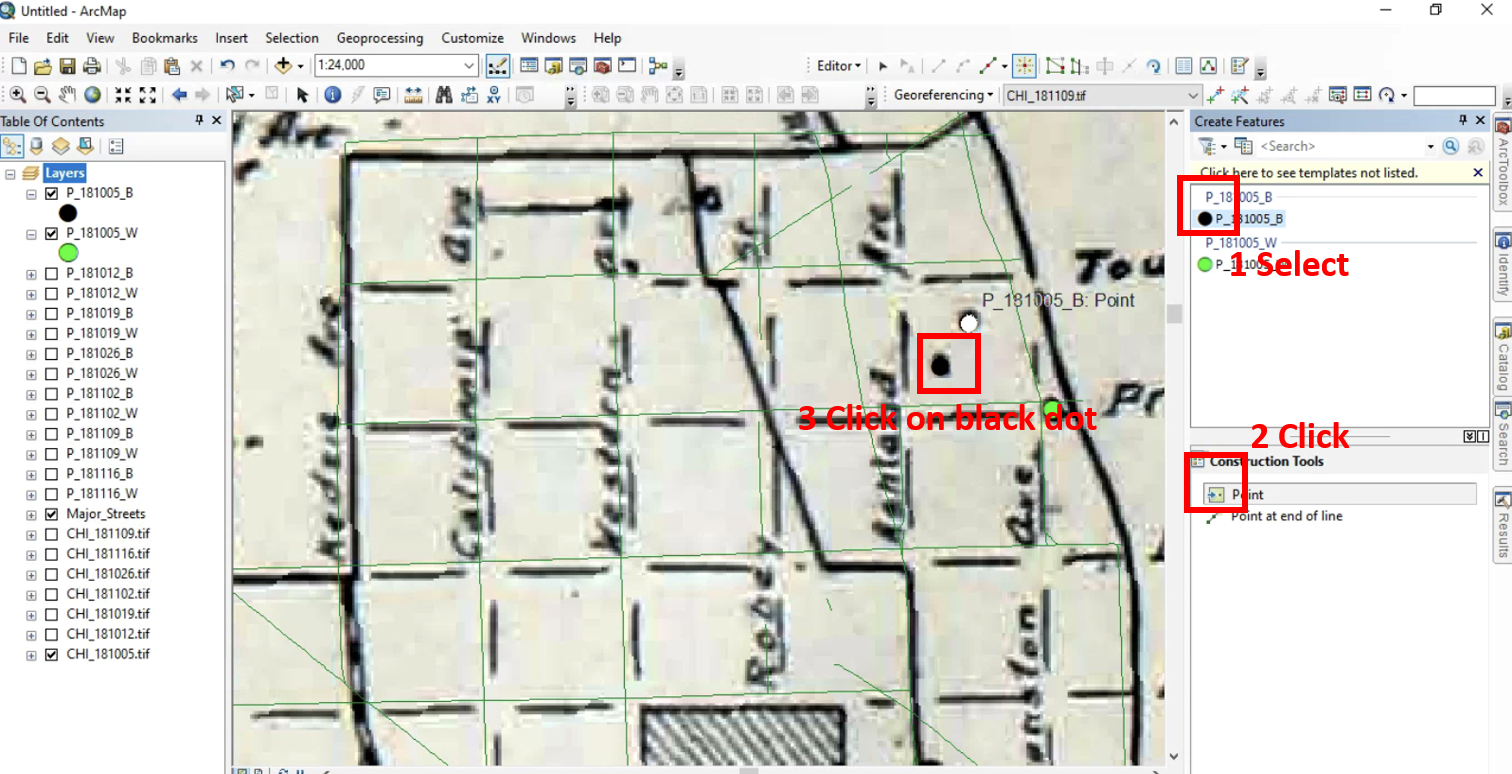
These degitized point map for each individual death were aggregated into the census tract map for better visualization
| DATE | |||||||
|---|---|---|---|---|---|---|---|
| INFLUENZA DEATH MAP | 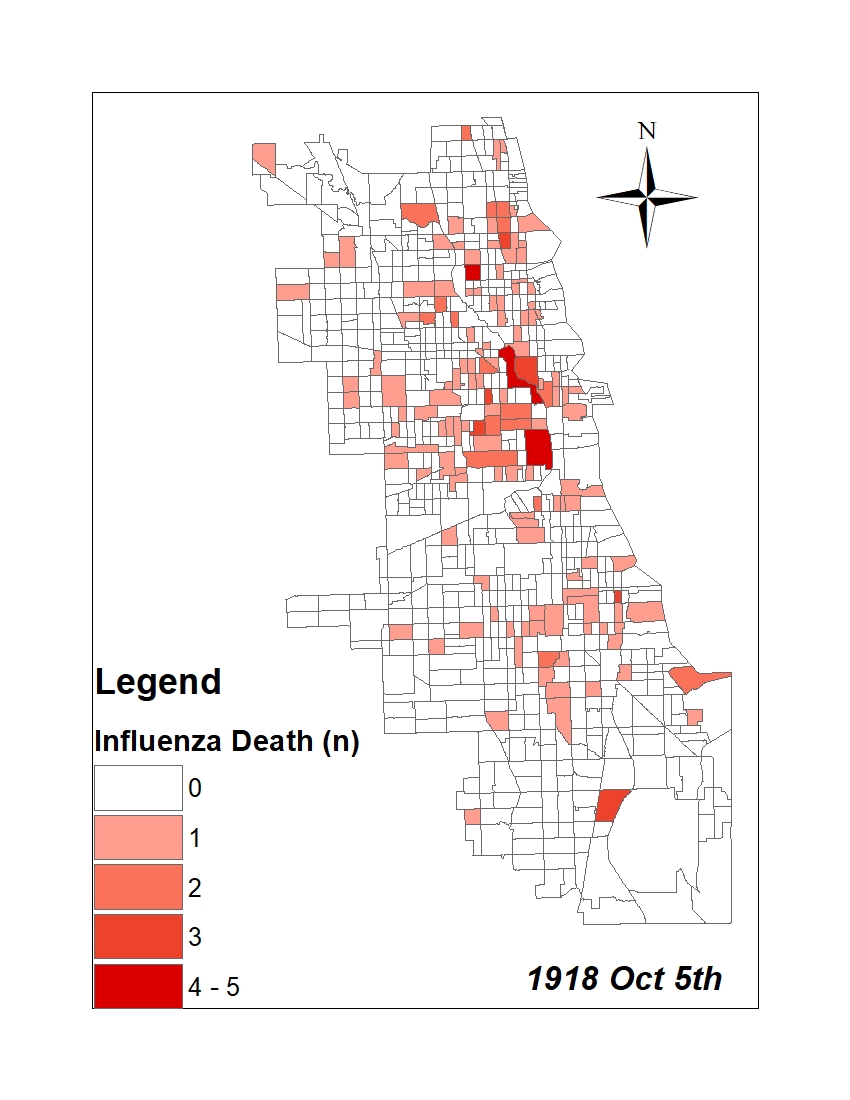 |
 |
 |
 |
 |
 |
 |
| PNUEMONIA DEATH MAP | 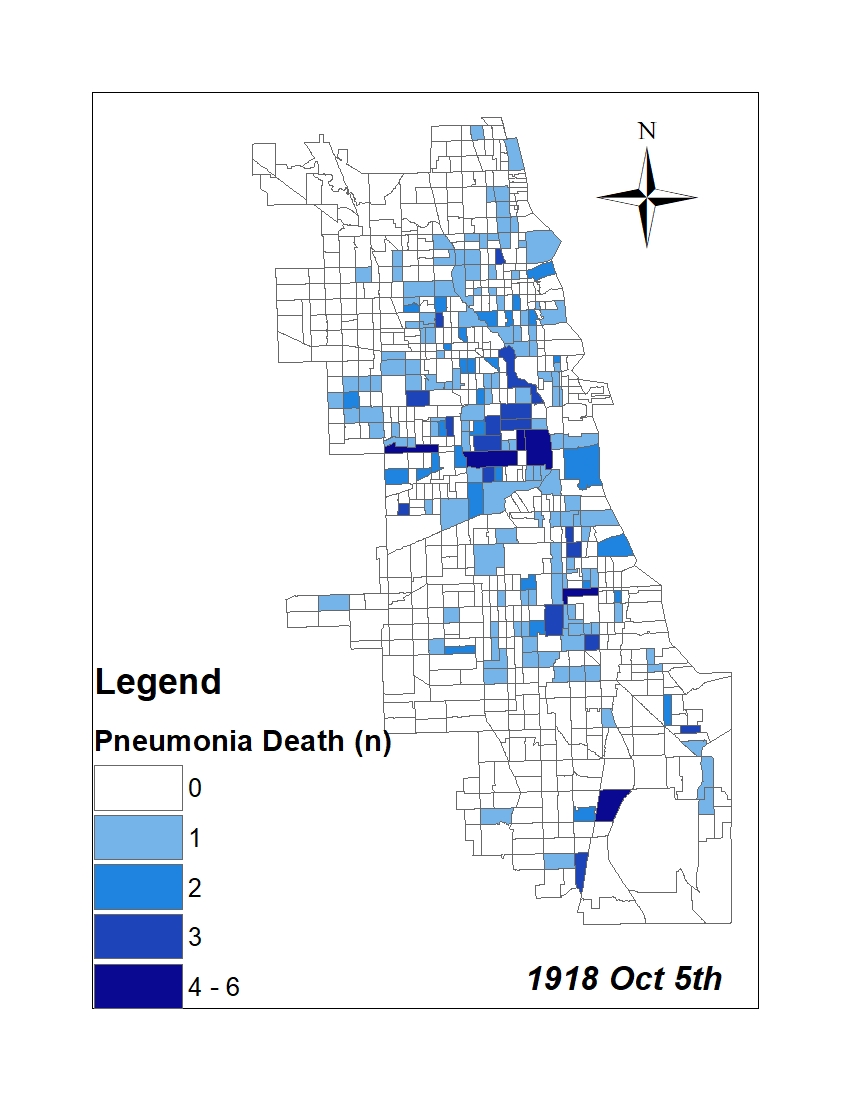 |
 |
 |
 |
 |
 |
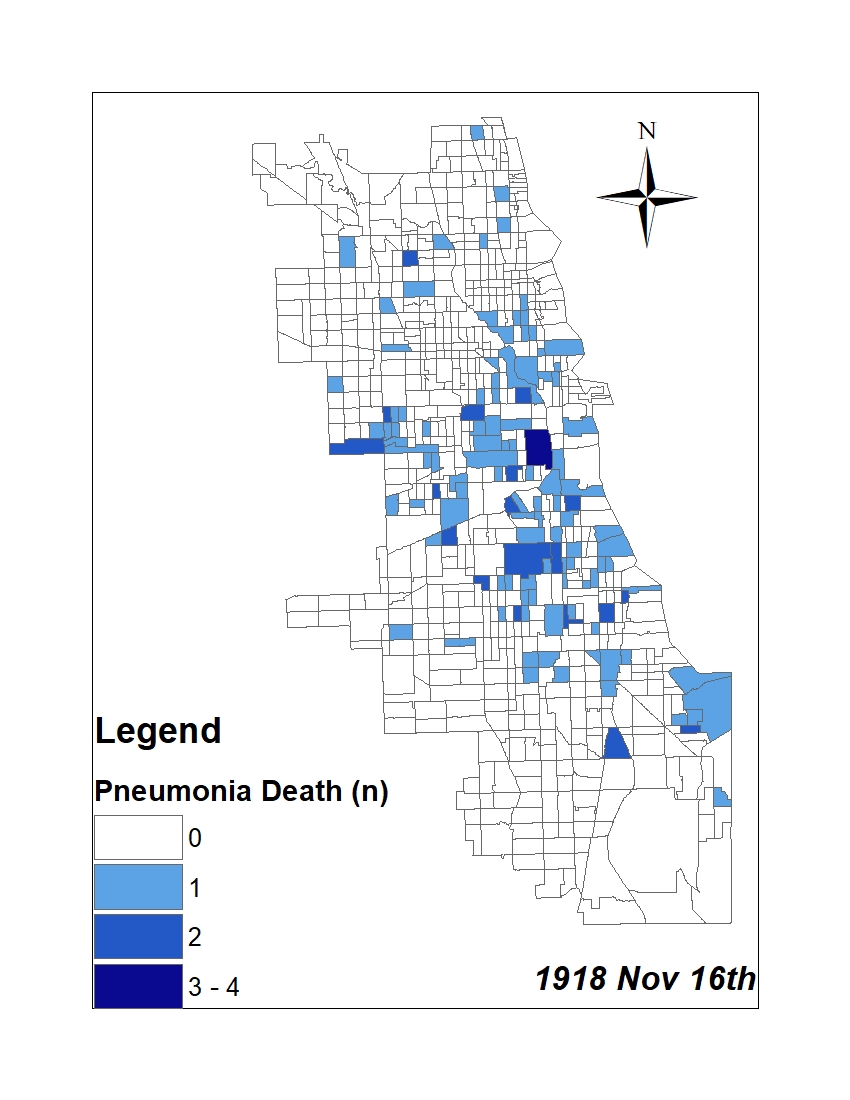 |
For the analysis, all 7 influenza and pnuemonia death maps were merged into the one map to examine the total death during 7 weeks periods.
2. Identifying neighborhood
Identifying spatial boundaries is important to assess race and neighborhood.
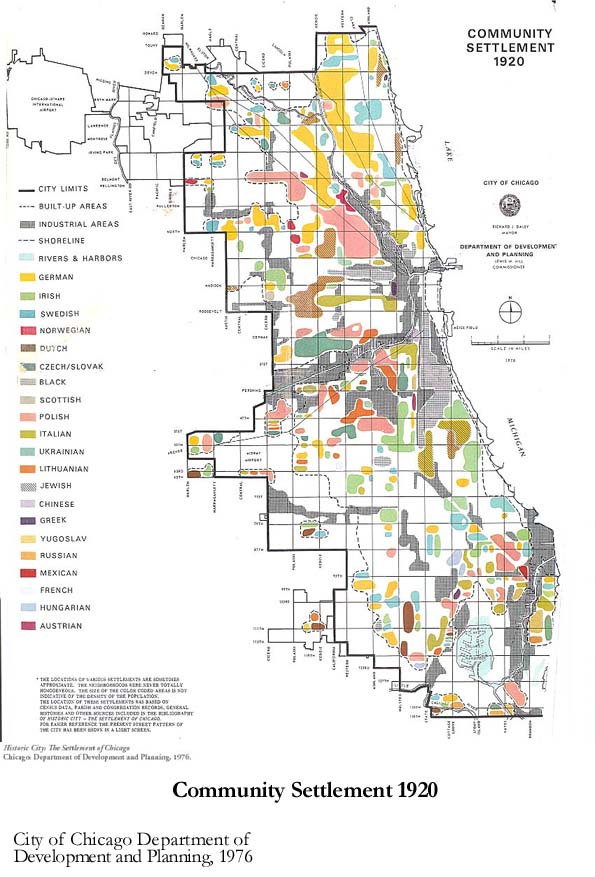
1) Community settlement map
Firstly, we used a community settlement map that is from the supplement of the book, Historic City – The settlement of Chicago, which is published by the department of development and planning the city of Chicago. This map not only shows the pattern of settlement of diverse racial groups in Chicago but also represents the cultural and cognitive boundary for each race. Moreover, the identified industrial area can provide environmental vulnerability based on its proximity.
 |
 |
 |
|---|---|---|
2) Census tract
To be released after publishing.3) Census ward
To be released after publishing.Interactive map for 1918 Influenza pandemic (Incomplete. Functioning version to be released upon publishing)
"""# import libraries
import numpy as np
from datetime import date, datetime
import pandas as pd
import geopandas as gpd

from bokeh.plotting import save, figure
from bokeh.io import show, output_notebook, push_notebook
from bokeh.models import GeoJSONDataSource, ColumnDataSource, CustomJS
from bokeh.models import LinearColorMapper, ColorBar
from bokeh.models import DataTable, DateFormatter, TableColumn
from bokeh.models import HoverTool, TapTool, Div
from bokeh.models import DateRangeSlider, Dropdown
from bokeh.palettes import brewer
from bokeh.events import Tap
from bokeh.tile_providers import Vendors, get_provider
from bokeh.layouts import gridplot, layout, column, row

import networkx as nx
import osmnx as ox
import matplotlib.pyplot as plt
import multiprocessing as mp
import folium, itertools, os, time, warnings

from shapely.geometry import Point, LineString, Polygon
from tqdm import tqdm
from IPython.display import display, clear_output

warnings.filterwarnings("ignore")"""
"""FLU_1005 = gpd.read_file("./Influenza_CHI/P_181005_B.shp")
FLU_1012 = gpd.read_file("./Influenza_CHI/P_181012_B.shp")
FLU_1019 = gpd.read_file("./Influenza_CHI/P_181019_B.shp")
FLU_1026 = gpd.read_file("./Influenza_CHI/P_181026_B.shp")
FLU_1102 = gpd.read_file("./Influenza_CHI/P_181102_B.shp")
FLU_1109 = gpd.read_file("./Influenza_CHI/P_181109_B.shp")
FLU_1116 = gpd.read_file("./Influenza_CHI/P_181116_B.shp")

PNA_1005 = gpd.read_file("./Influenza_CHI/P_181005_W.shp")
PNA_1012 = gpd.read_file("./Influenza_CHI/P_181012_W.shp")
PNA_1019 = gpd.read_file("./Influenza_CHI/P_181019_W.shp")
PNA_1026 = gpd.read_file("./Influenza_CHI/P_181026_W.shp")
PNA_1102 = gpd.read_file("./Influenza_CHI/P_181102_W.shp")
PNA_1109 = gpd.read_file("./Influenza_CHI/P_181109_W.shp")
PNA_1116 = gpd.read_file("./Influenza_CHI/P_181116_W.shp")

FLU_1005_C=FLU_1005.to_crs(epsg=4326)
FLU_1012_C=FLU_1012.to_crs(epsg=4326)
FLU_1019_C=FLU_1019.to_crs(epsg=4326)
FLU_1026_C=FLU_1026.to_crs(epsg=4326)
FLU_1102_C=FLU_1102.to_crs(epsg=4326)
FLU_1109_C=FLU_1109.to_crs(epsg=4326)
FLU_1116_C=FLU_1116.to_crs(epsg=4326)

PNA_1005_C=PNA_1005.to_crs(epsg=4326)
PNA_1012_C=PNA_1012.to_crs(epsg=4326)
PNA_1019_C=PNA_1019.to_crs(epsg=4326)
PNA_1026_C=PNA_1026.to_crs(epsg=4326)
PNA_1102_C=PNA_1102.to_crs(epsg=4326)
PNA_1109_C=PNA_1109.to_crs(epsg=4326)
PNA_1116_C=PNA_1116.to_crs(epsg=4326)


FLU_1005_C['date']='1918/10/05'
FLU_1012_C['date']='1918/10/12'
FLU_1019_C['date']='1918/10/19'
FLU_1026_C['date']='1918/10/26'
FLU_1102_C['date']='1918/11/02'
FLU_1109_C['date']='1918/11/09'
FLU_1116_C['date']='1918/11/16'

PNA_1005_C['date']='1918/10/05'
PNA_1012_C['date']='1918/10/12'
PNA_1019_C['date']='1918/10/19'
PNA_1026_C['date']='1918/10/26'
PNA_1102_C['date']='1918/11/02'
PNA_1109_C['date']='1918/11/09'
PNA_1116_C['date']='1918/11/16'

FLU_1005_C['type']='Flu'
FLU_1012_C['type']='Flu'
FLU_1019_C['type']='Flu'
FLU_1026_C['type']='Flu'
FLU_1102_C['type']='Flu'
FLU_1109_C['type']='Flu'
FLU_1116_C['type']='Flu'

PNA_1005_C['type']='Pna'
PNA_1012_C['type']='Pna'
PNA_1019_C['type']='Pna'
PNA_1026_C['type']='Pna'
PNA_1102_C['type']='Pna'
PNA_1109_C['type']='Pna'
PNA_1116_C['type']='Pna'

FLU_1005_C['timestamp'] =  [datetime.timestamp(datetime.strptime(date, '%Y/%m/%d')) for date in FLU_1005_C['date']]
FLU_1012_C['timestamp'] =  [datetime.timestamp(datetime.strptime(date, '%Y/%m/%d')) for date in FLU_1012_C['date']]
FLU_1019_C['timestamp'] =  [datetime.timestamp(datetime.strptime(date, '%Y/%m/%d')) for date in FLU_1019_C['date']]
FLU_1026_C['timestamp'] =  [datetime.timestamp(datetime.strptime(date, '%Y/%m/%d')) for date in FLU_1026_C['date']]
FLU_1102_C['timestamp'] =  [datetime.timestamp(datetime.strptime(date, '%Y/%m/%d')) for date in FLU_1102_C['date']]
FLU_1109_C['timestamp'] =  [datetime.timestamp(datetime.strptime(date, '%Y/%m/%d')) for date in FLU_1109_C['date']]
FLU_1116_C['timestamp'] =  [datetime.timestamp(datetime.strptime(date, '%Y/%m/%d')) for date in FLU_1116_C['date']]

PNA_1005_C['timestamp'] =  [datetime.timestamp(datetime.strptime(date, '%Y/%m/%d')) for date in PNA_1005_C['date']]
PNA_1012_C['timestamp'] =  [datetime.timestamp(datetime.strptime(date, '%Y/%m/%d')) for date in PNA_1012_C['date']]
PNA_1019_C['timestamp'] =  [datetime.timestamp(datetime.strptime(date, '%Y/%m/%d')) for date in PNA_1019_C['date']]
PNA_1026_C['timestamp'] =  [datetime.timestamp(datetime.strptime(date, '%Y/%m/%d')) for date in PNA_1026_C['date']]
PNA_1102_C['timestamp'] =  [datetime.timestamp(datetime.strptime(date, '%Y/%m/%d')) for date in PNA_1102_C['date']]
PNA_1109_C['timestamp'] =  [datetime.timestamp(datetime.strptime(date, '%Y/%m/%d')) for date in PNA_1109_C['date']]
PNA_1116_C['timestamp'] =  [datetime.timestamp(datetime.strptime(date, '%Y/%m/%d')) for date in PNA_1116_C['date']]

FLU_1005_C ['rat_color']  = 'red'
FLU_1012_C ['rat_color']  = 'red'
FLU_1019_C ['rat_color']  = 'red'
FLU_1026_C ['rat_color']  = 'red'
FLU_1102_C ['rat_color']  = 'red'
FLU_1109_C ['rat_color']  = 'red'
FLU_1116_C ['rat_color']  = 'red'

PNA_1005_C ['rat_color']  =  'blue'
PNA_1012_C ['rat_color']  =  'blue'
PNA_1019_C ['rat_color']  =  'blue'
PNA_1026_C ['rat_color']  =  'blue'
PNA_1102_C ['rat_color']  =  'blue'
PNA_1109_C ['rat_color']  =  'blue'
PNA_1116_C ['rat_color']  =  'blue'

FLU_Point = FLU_1005_C
FLU_Point = FLU_Point.append(FLU_1012_C)
FLU_Point = FLU_Point.append(FLU_1019_C)
FLU_Point = FLU_Point.append(FLU_1026_C)
FLU_Point = FLU_Point.append(FLU_1102_C)
FLU_Point = FLU_Point.append(FLU_1109_C)
FLU_Point = FLU_Point.append(FLU_1116_C)

PNA_Point = PNA_1005_C
PNA_Point = PNA_Point.append(PNA_1012_C)
PNA_Point = PNA_Point.append(PNA_1019_C)
PNA_Point = PNA_Point.append(PNA_1026_C)
PNA_Point = PNA_Point.append(PNA_1102_C)
PNA_Point = PNA_Point.append(PNA_1109_C)
PNA_Point = PNA_Point.append(PNA_1116_C)

Final_Point = FLU_Point.append(PNA_Point)

# record data sources for bokeh
tl_data= [['10/05/1918',"Week 1"],
          ['10/26/1918',"Week 4"],
          ['11/16/1918',"Week 7"]]
tl_df= pd.DataFrame(tl_data, columns = ['tl_date', 'tl_note'])
tl_df['tl_ts'] = [datetime.timestamp(datetime.strptime(date, '%m/%d/%Y'))*1000
                  for date in tl_df['tl_date']]"""
"""Final_source = GeoJSONDataSource(geojson=Final_Point.to_json())
Final_disp_source = GeoJSONDataSource(geojson=Final_Point.to_json())
timeline_source = ColumnDataSource(tl_df)

tile_provider2 = get_provider(Vendors.CARTODBPOSITRON)

s4 = figure(title="Influenza Map", plot_width=500, x_range=(-9800000, -9740000), y_range=(5100000, 5170000),
            tooltips=[("", "@Title")], tools="tap")
s4.toolbar.logo = None
s4.toolbar_location = None
s4.add_tile(tile_provider2)

# plot points for movie locations
Final_pts = s4.circle(x='x', y='y', source=Final_disp_source, fill_color='rat_color', legend_label='Flu', size=5)
print(Final_pts)

# plot points for movie locations
Final_pts = s4.circle(x='x', y='y', source=Final_disp_source, fill_color='rat_color', legend_label='Flu', size=5)

# add a dropdown menu to change the point color
menu = [("Default", "default"), ("Type", "type")]
callback_p = CustomJS(args = dict(source = Final_source,
                                  fill_source = Final_disp_source,
                                  s4 = s4, Final_pts = Final_pts),
"""                         code = """
var data = source.data;
var fill_data = fill_source.data;
var choice =  this.item;

if (choice == "Flu") {
    fill_data['rat_color'] = [];

    for (var i = 0; i < data.x.length; i++) {

        if (fill_data['type'][i] == "Flu") {
            fill_data['rat_color'].push('red');
        }
    }
    Final_pts.glyph.fill_color.field = 'rat_color';
} else {
    Final_pts.glyph.fill_color = 'blue';
}

fill_source.change.emit();
    """)

"""dropdown = Dropdown(label="Change Point Color", button_type="warning", menu=menu)
dropdown.js_on_event("menu_item_click", callback_p)

# add a data range slider

callback_t = CustomJS(args = dict(source = Final_source, fill_source = Final_disp_source),
"""                         code = """
var data = source.data;
var fill_data = fill_source.data;
var s_val = cb_obj.value;
fill_data['x']=[];
fill_data['y']=[];
for (var i = 0; i < data.x.length; i++) {
    if ((data['timestamp'][i] >= (s_val[0]/1000))
    && (data['timestamp'][i] <= (s_val[1]/1000))) {
        fill_data['y'].push(source.data['y'][i]);
        fill_data['x'].push(source.data['x'][i]);
    } else {
        fill_data['y'].push(NaN);
        fill_data['x'].push(NaN);
    }
    }

fill_source.change.emit();
""")

"""date_range_slider = DateRangeSlider(value=(date(1918, 10, 1), date(1918, 11, 15)),
                                    start=date(1918, 6, 1), end=date(1918, 12, 31))
date_range_slider.js_on_change("value", callback_t)
div = Div(text="""""", width=200, height=100)

# add tap tool to display text when point is selected
taptool = s4.select(type=TapTool)
taptool.callback =  CustomJS(args = dict(source = Final_disp_source, div = div),
""" code = """
     var data = source.data;
     const inds = source.selected.indices;
     var base_str = "";
     for (const indx in inds) {
         base_str = base_str.concat('id: ', inds[indx].toString(), '<br />');
         base_str = base_str.concat('date: ', data['Date'][inds[indx]], '<br />');
         base_str = base_str.concat('title: ', data['type'][inds[indx]], '<br />');
     }
     div.text = base_str;

""")


"""tl_hover = HoverTool(
        tooltips=n    <div>
        <div>
            <img
                src="@tl_image" height="42" width="42"
                style="float: left; margin: 0px 15px 15px 0px;"
                onerror="this.style.display='none'"
            ></img>
        </div>
        <div>
            <span style="font-size: 17px; font-weight: bold;">@tl_date</span>
            <br>
            <span style="font-size: 15px; color: #966;">@tl_note</span>
        </div>
    </div>
        """)

"""s5 = figure(title="Timeline", x_axis_type='datetime',  tools=[tl_hover],
            plot_height=100,
            # multiply x range by 1000 to convert between microseconds
           x_range=(datetime.timestamp(datetime.strptime('09/01/1918', '%m/%d/%Y'))*1000,
                    datetime.timestamp(datetime.strptime('12/31/1918', '%m/%d/%Y'))*1000),
            y_range=(0.5, 1.5))
s5.yaxis.major_label_text_font_size = '0pt'
s5.toolbar.logo = None
s5.toolbar_location = None
tl_pts = s5.triangle(x='tl_ts', y=1, source=timeline_source, fill_color='red', size=20)

date_range_slider.js_link('value', s5.x_range, 'start')
date_range_slider.js_link('value', s5.x_range, 'end')

t = show((column(row(s4, div), dropdown, date_range_slider, s5)), notebook_handle=True)"""
2. COVID-19
To be released after publishing.