Georeferencing with ESRI ArcMap Instructions
Author: Rebecca Vandewalle rcv3@illinois.edu
Created: 5-21-21
This notebook contains instructions for how to georeference an image. These instructions are intended for those who have access to ESRI ArcMap.
Contents
- Introduction
- Gather Initial Data for Georeferencing
- Open ArcMap
- Load the Major Streets Dataset
- Load the Chicago Map
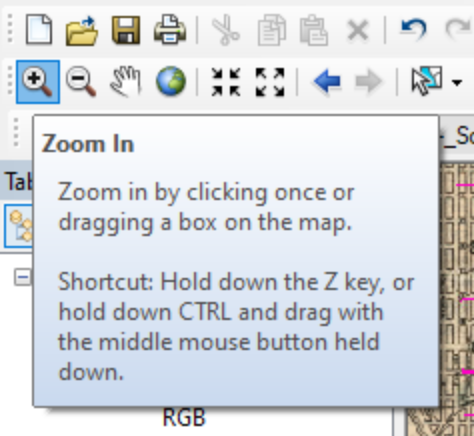
- Navigating
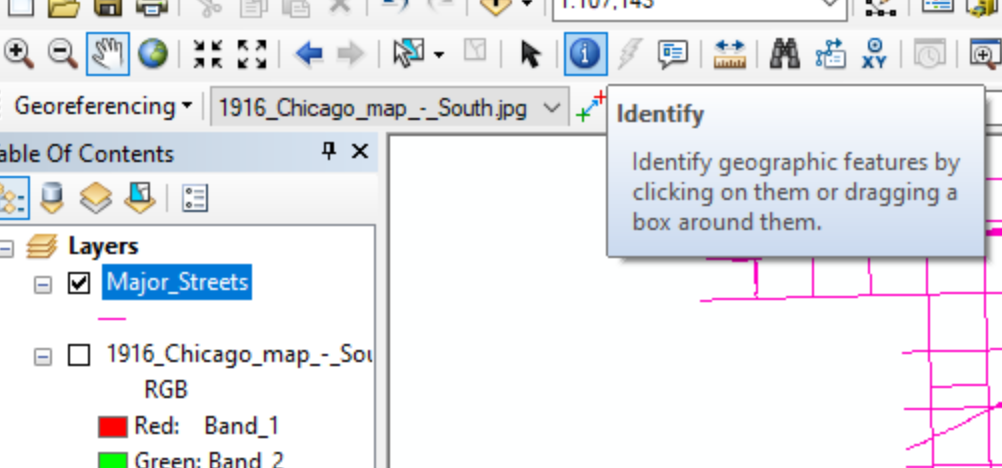
- Using the Identify Tool
- Preparing to Georeference
- Starting Georeferencing: Adding Control Points
- Completing the Georeferencing Process: Rectifying
- Loading the Rectified Image
Introduction
This notebook is intended to demonstrate how to transform geospatial data from an image to a digital file that can be used in maps. This demo will use ESRI ArcMap.
Learning Goals:
- Georeference an image using reference data
Gather Initial Data for Georeferencing
We will need to start with two datasets:
- The map image that we wish to collect data from
- A reference data set to give spatial information to the map
The Map
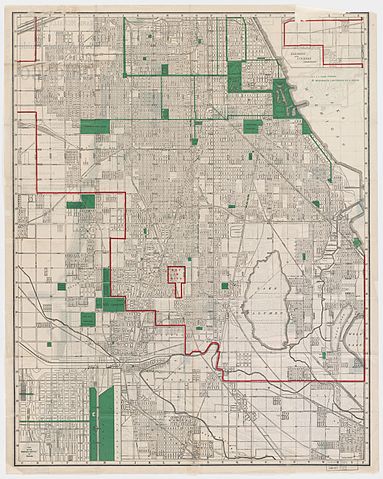
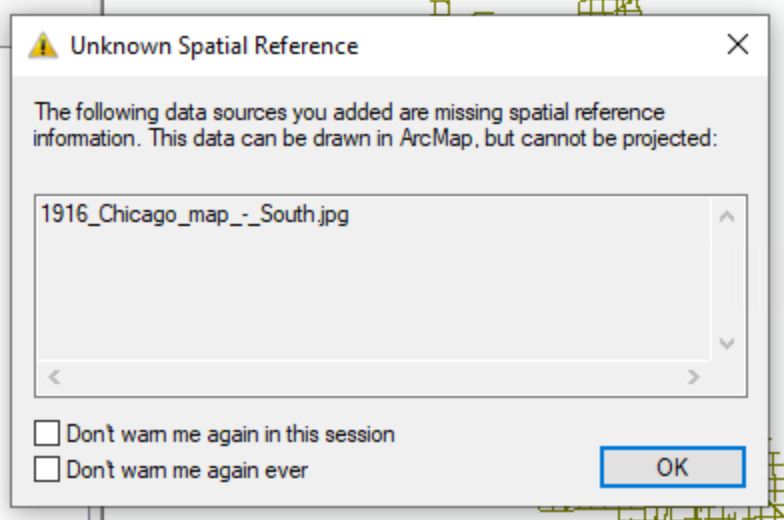
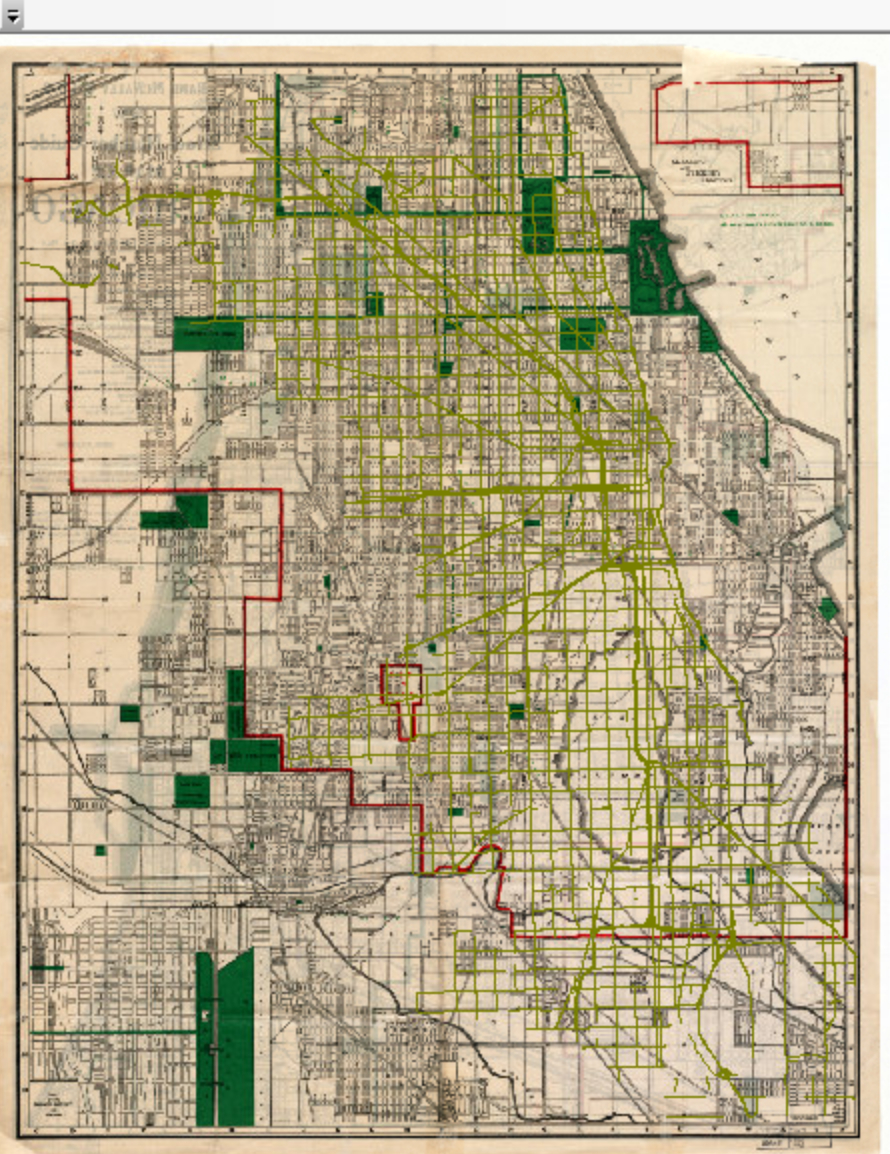
The map image we will work with is Rand McNally & Co.'s new street number guide map of Chicago (1916) from the Harvard Map Collection. You can download the map from Wikipedia here (make sure to download the full version) or use the map that has been uploaded to the root folder of this tutorial (1916_Chicago_map_-_South.jpg).
The reference data
We also will need data that has geospatial information included to use as a reference when we add geospatial information to the map. This dataset needs to include features that we can find the location of in both the data set and the map. It is slightly difficult because the map is from 1916 and the reference data is current, however many of the modern major roads and railroads are in the same place as they were in 1916 and can be used to reference the map.
The City of Chicago has a nice data portal here (use the gis tag and the shapefiles tag). From this portal we can download the Major Streets dataset by going to this link and selecting Download. For convienience, this dataset is also available in the Chicago_Major_Streets folder.
Prepare to work with the data
Now that you have the data we will start working in ArcMap. If you are accessing ArcMap using a remote desktop, you will first need to transfer your files to the remote desktop.
Open ArcMap
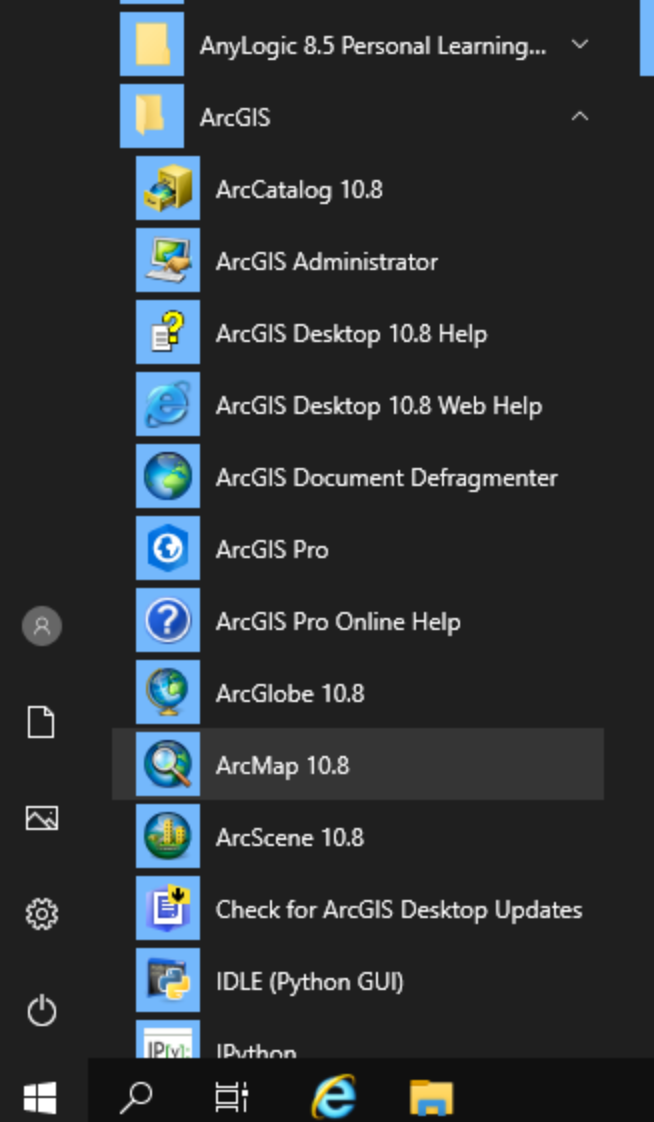
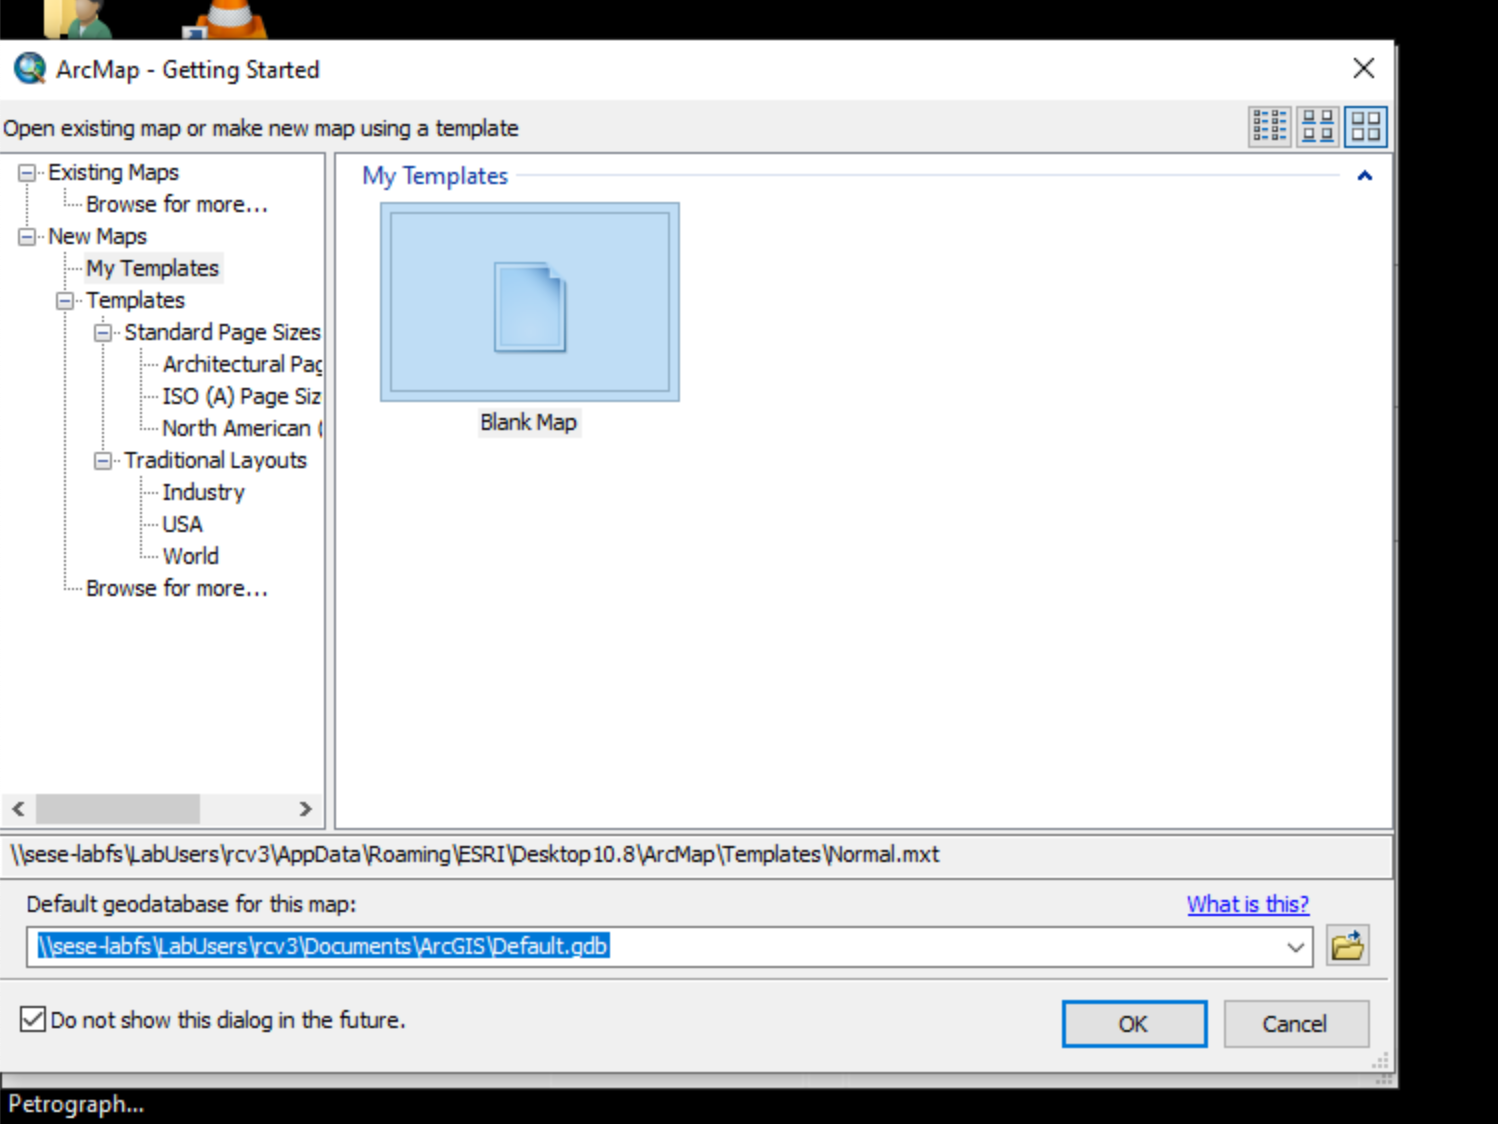
To open ArcMap, click on the Start Menu, click on the ArcGIS folder, and then select ArcMap 10.8. A new ArcMap Getting Started window will open. Select Blank Map.
 |
 |
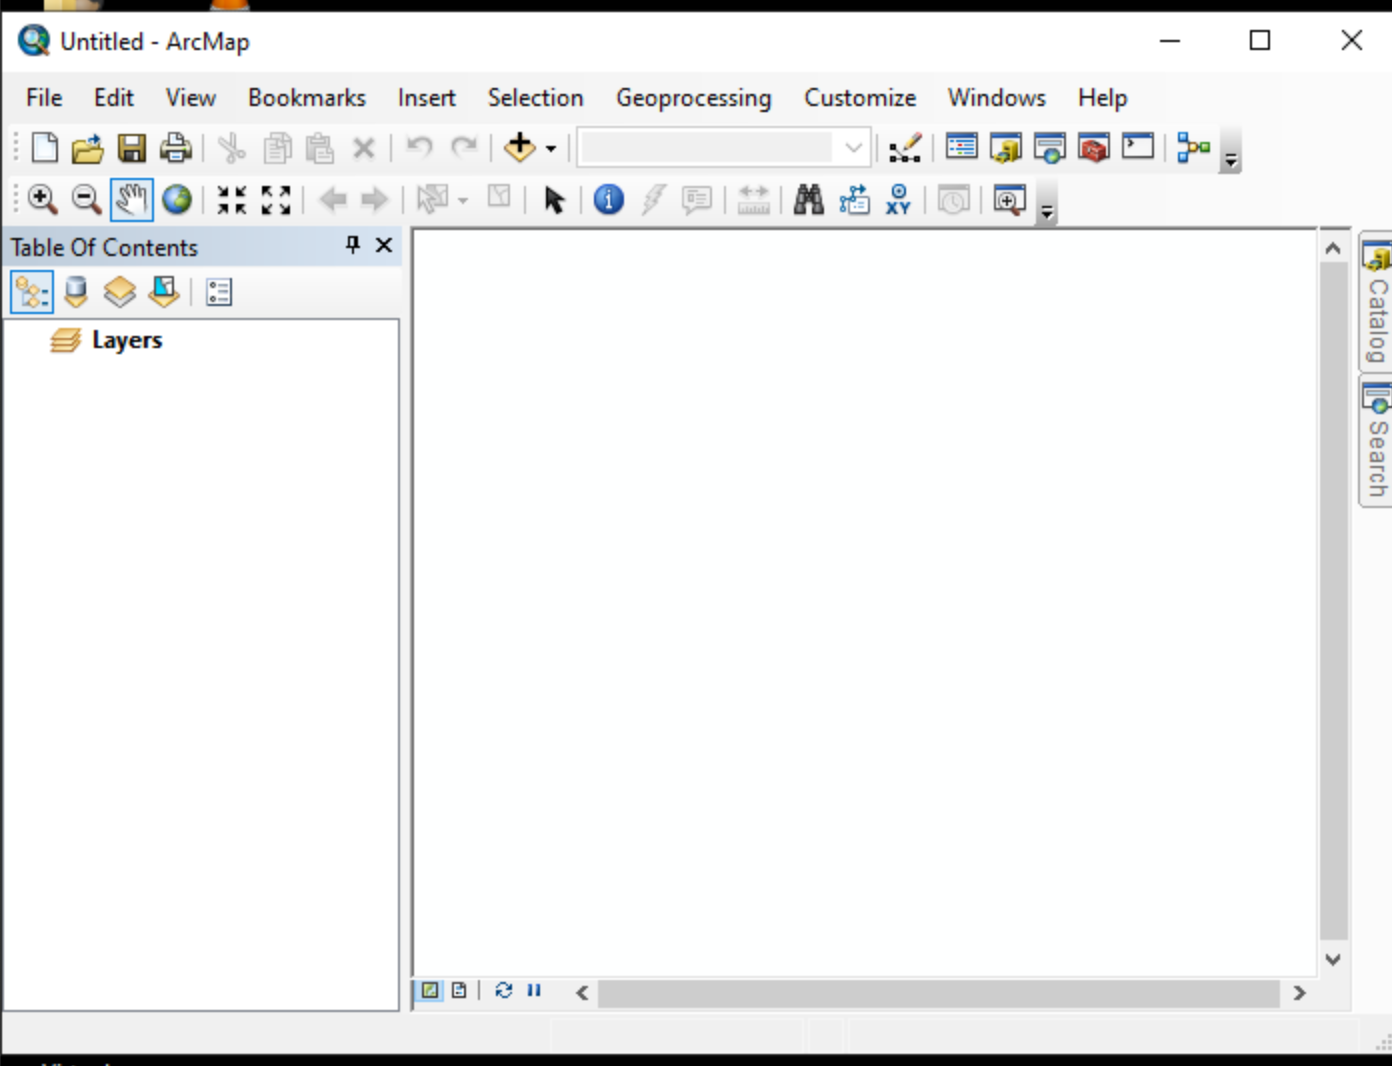
A new ArcMap project window will open:
Load the Major Streets Dataset
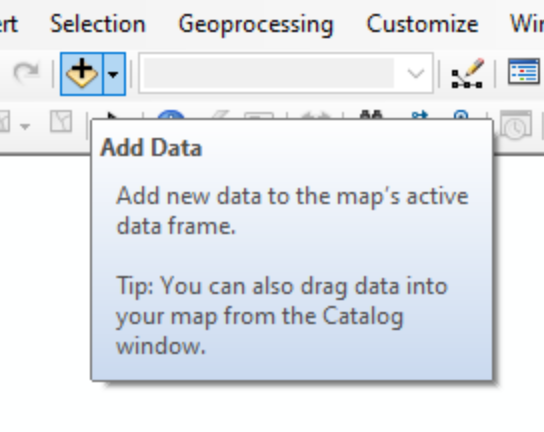
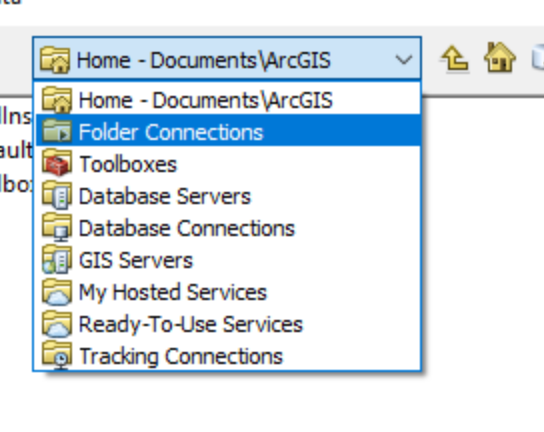
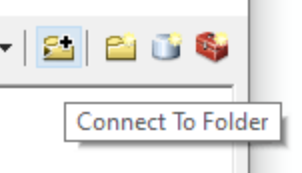
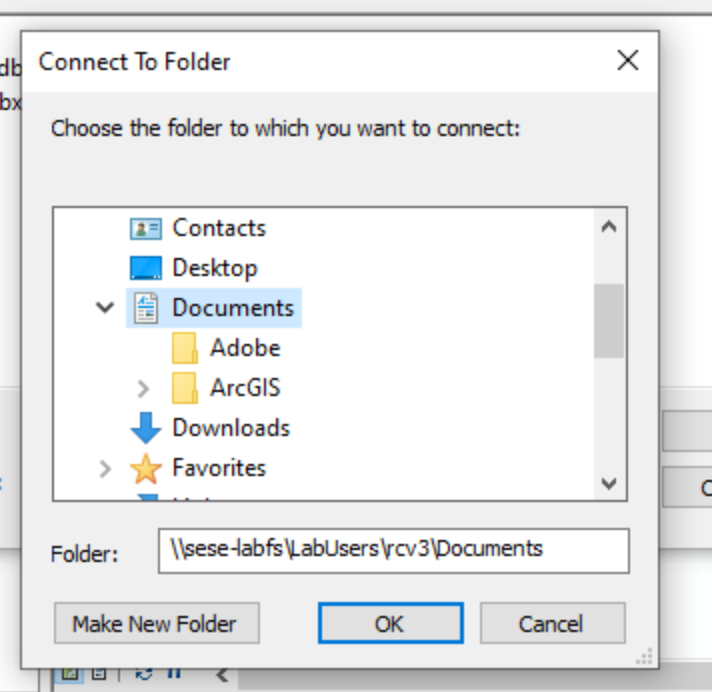
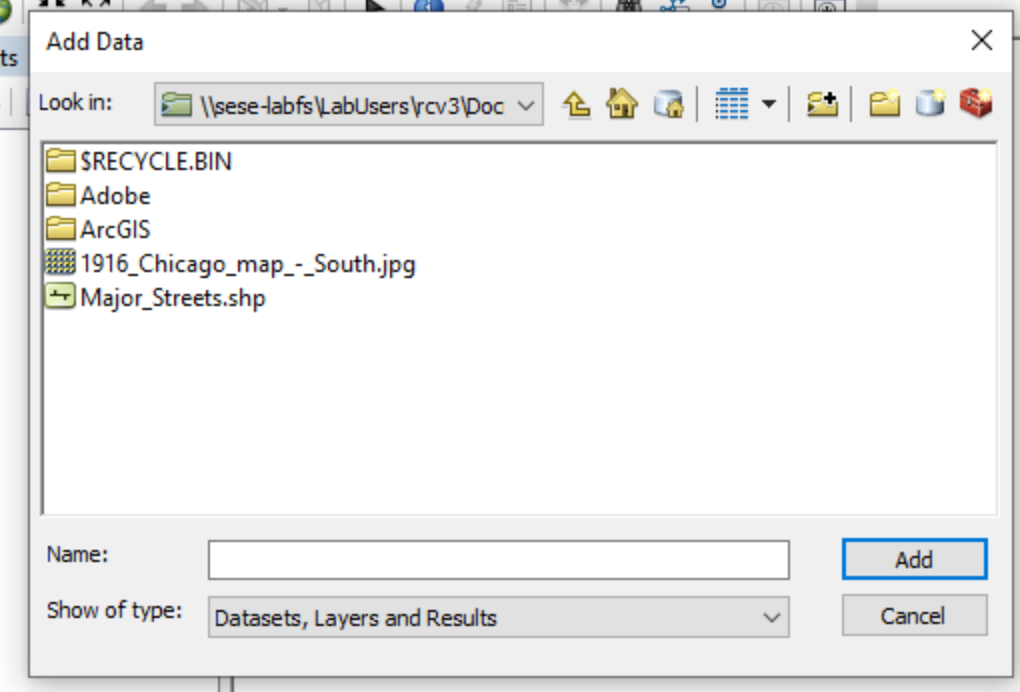
First you need to add data. Select the Add Data button. This will open the Add Data window. In the Add Data window some folder options will be displayed, however if the folder you have stored your data in is not one of the drop down options, select the Connect to Folder button and then navigate to folder holding your data and select OK.
 |
 |
 |
 |
After connecting to the folder with your data you will see the data files you have uploaded. Select ONLY Major_Streets.shp and click Add.
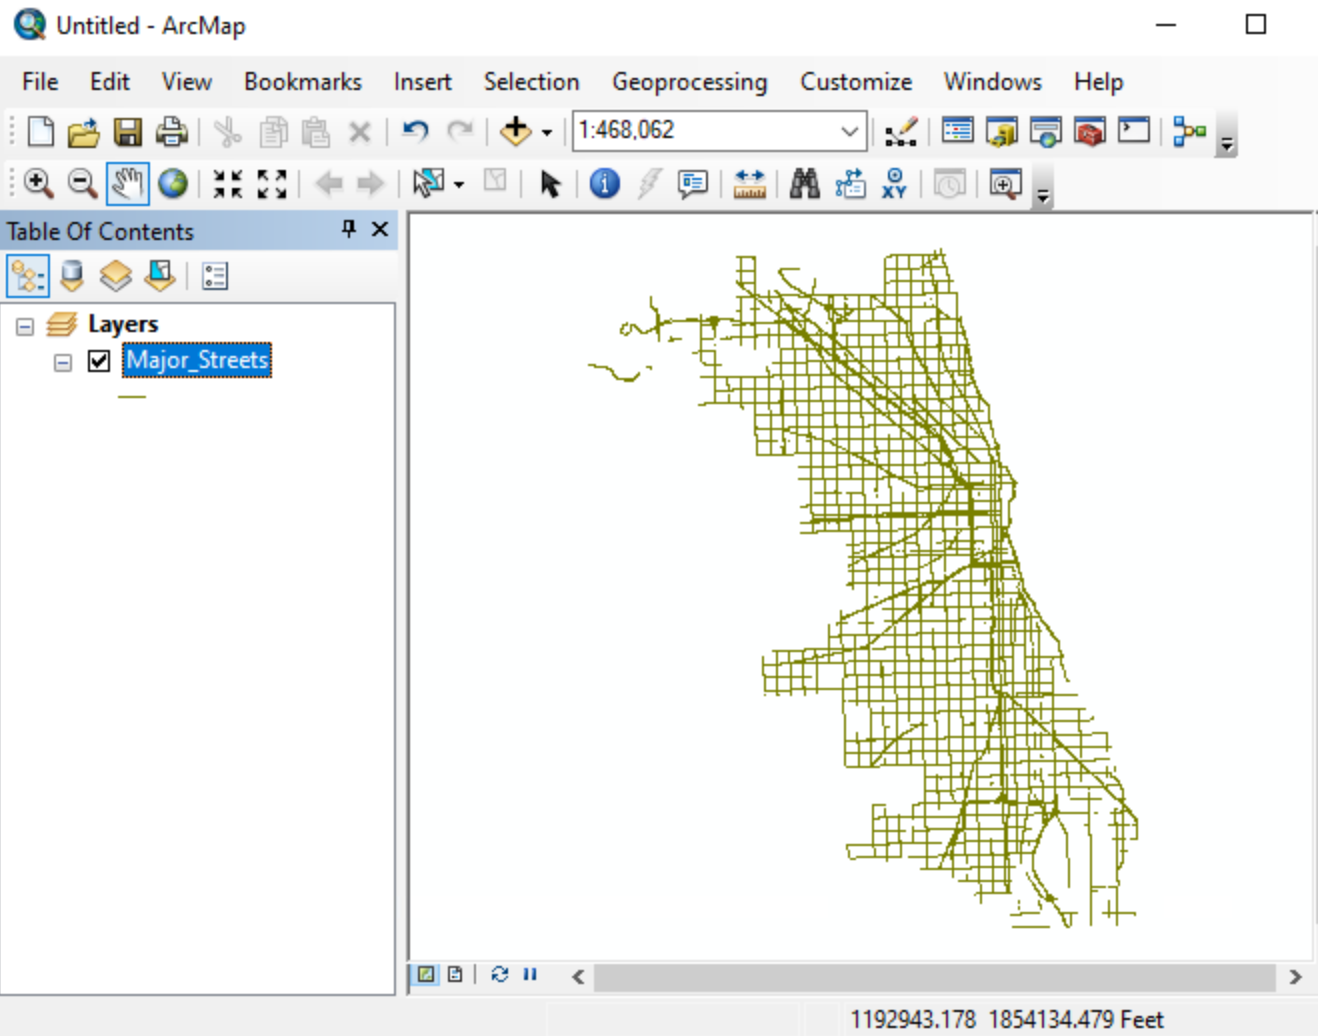
You will now see Major_Streets loaded into your project. The initial display color is random. Now would be a good time to save your ArcMap file by selecting File -> Save.
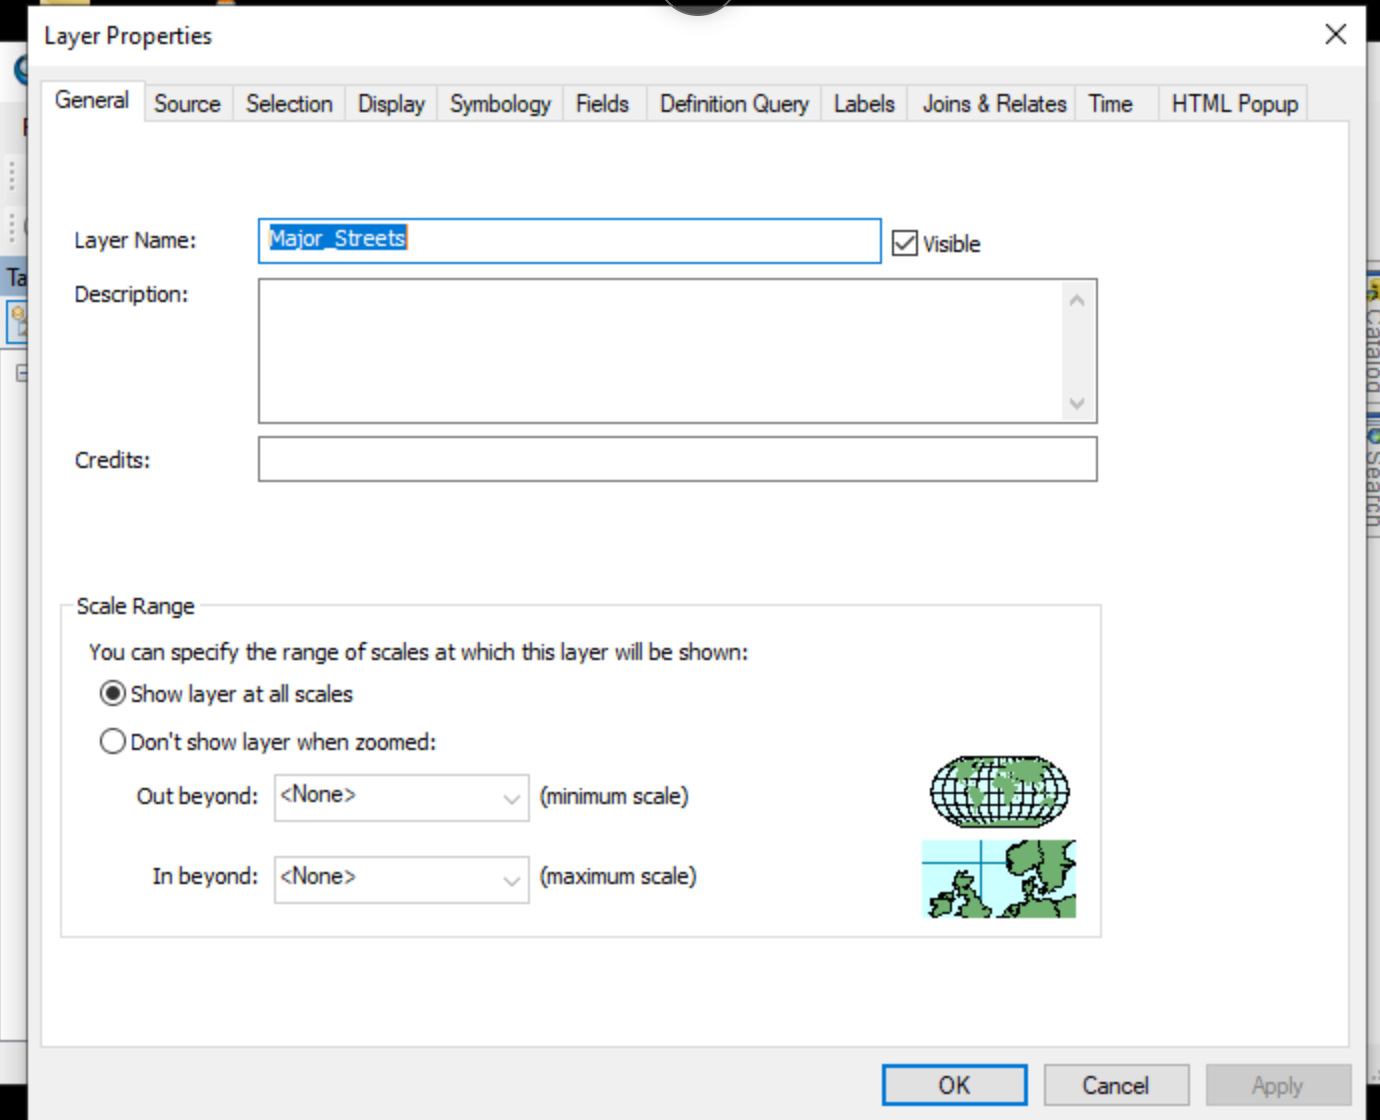
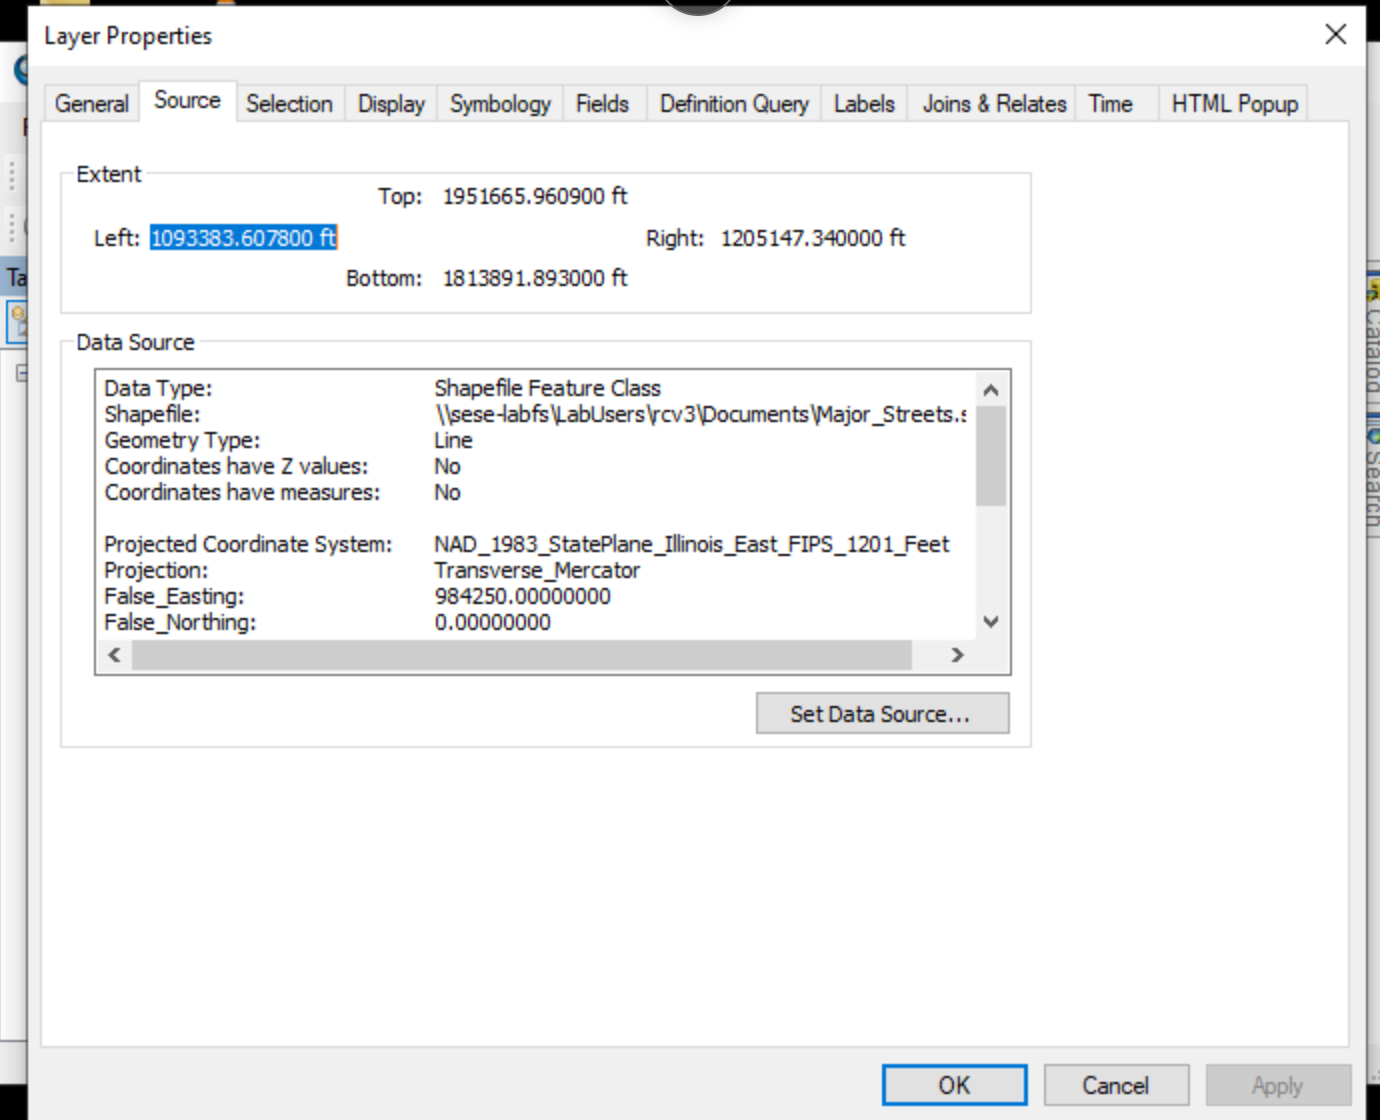
Now you can check the properties of Major_Streets. Right Click on Major_Streets in the Table of Contents pane and select Properties... at the bottom of the pop up menu. This will open the Layer Properties window to the General tab. Select the Source tab and look at the source information. Note that there is information under Projected Coordinate System. This indicates that this data file has been projected, which means that the coordinates indicate locations on a flat surface instead of raw latitude and longitude values. This information will be used to add spatial information to the Chicago map.
 |
 |
 |
 |
 |
 |
 |
 |
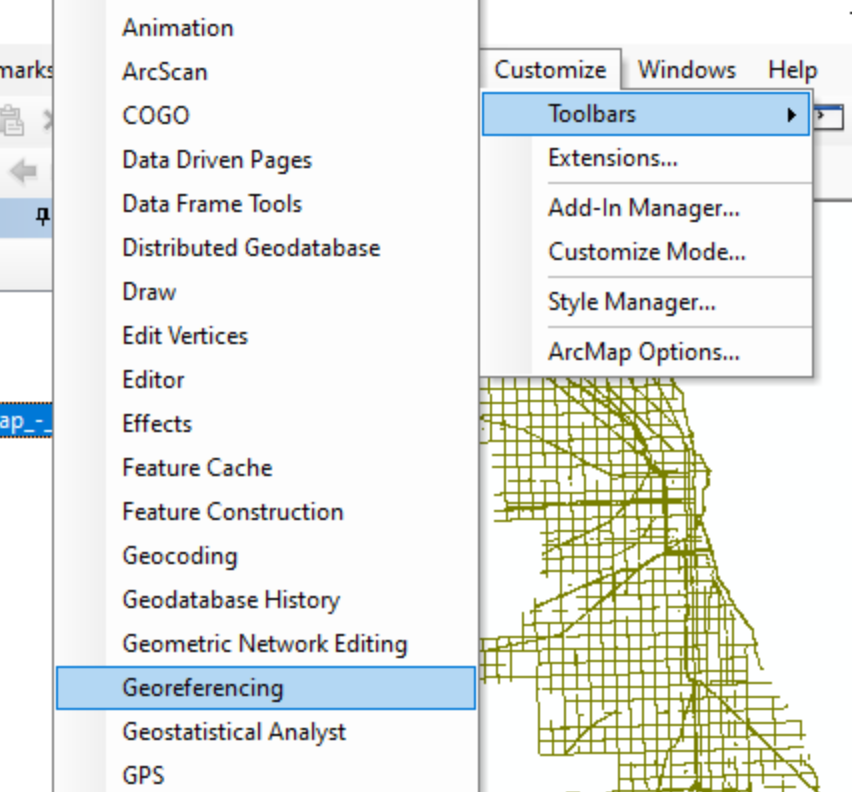
Preparing to Georeference
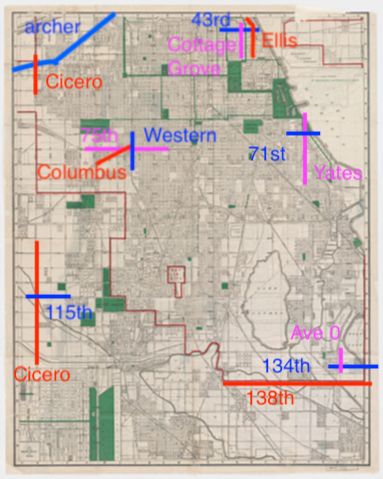
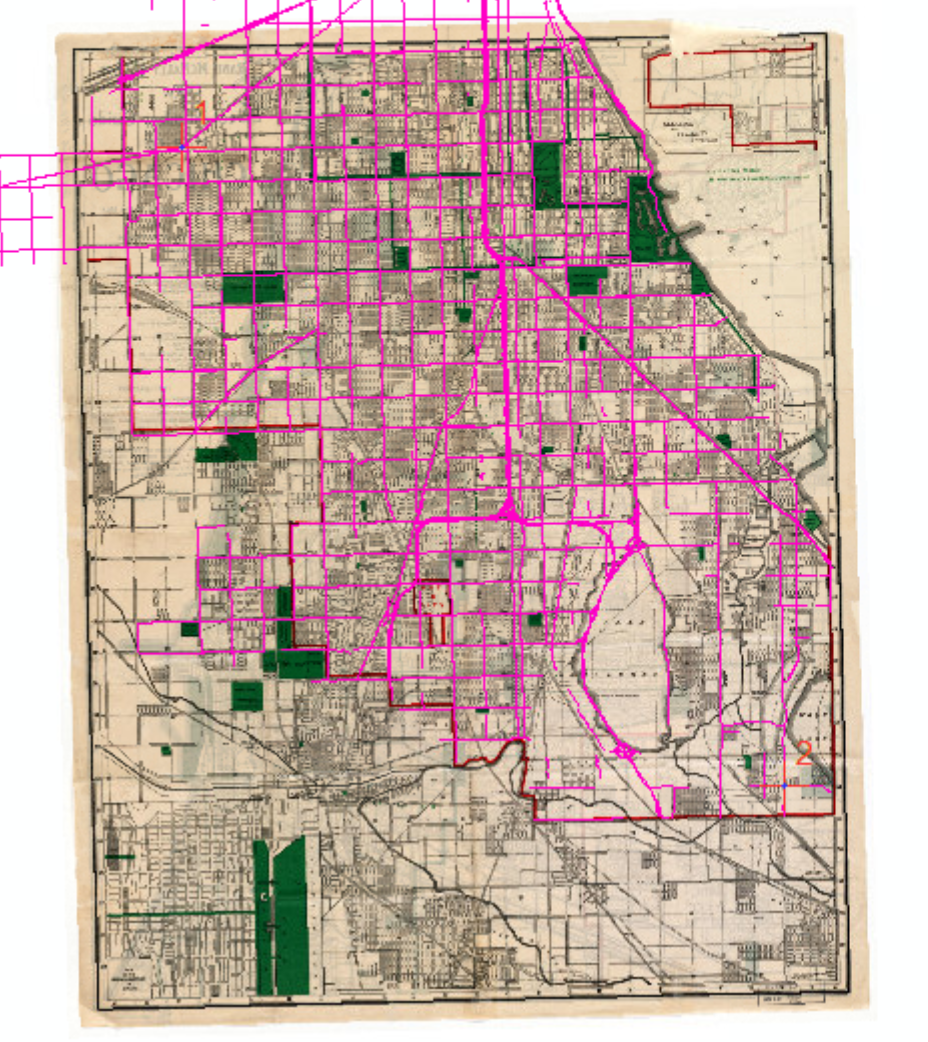
Before starting to georeference it is important to look at both the Major_Streets data set and the map itself to identify places where they match up. Ideally you will want to choose at least one point for every corner of the map image for the best results. It helps to look for irregular features that will be easy to spot on both the Chicago map and the Major_Streets data. I opened the full map in another window so that I could zoom in and read all the small street names. Then I made a sketch map with a smaller version of the map and made notes for myself for where some easily identifiable features were. Since the map is from 1916, some street names and locations have changed in the modern data set.
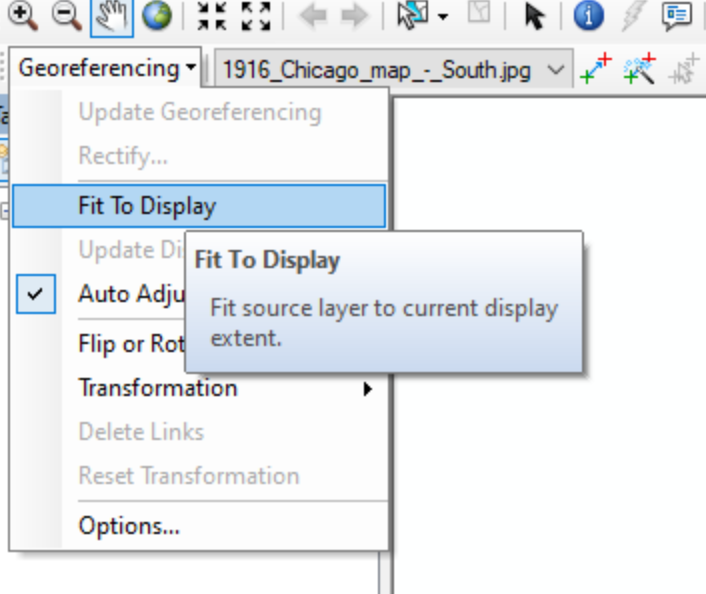
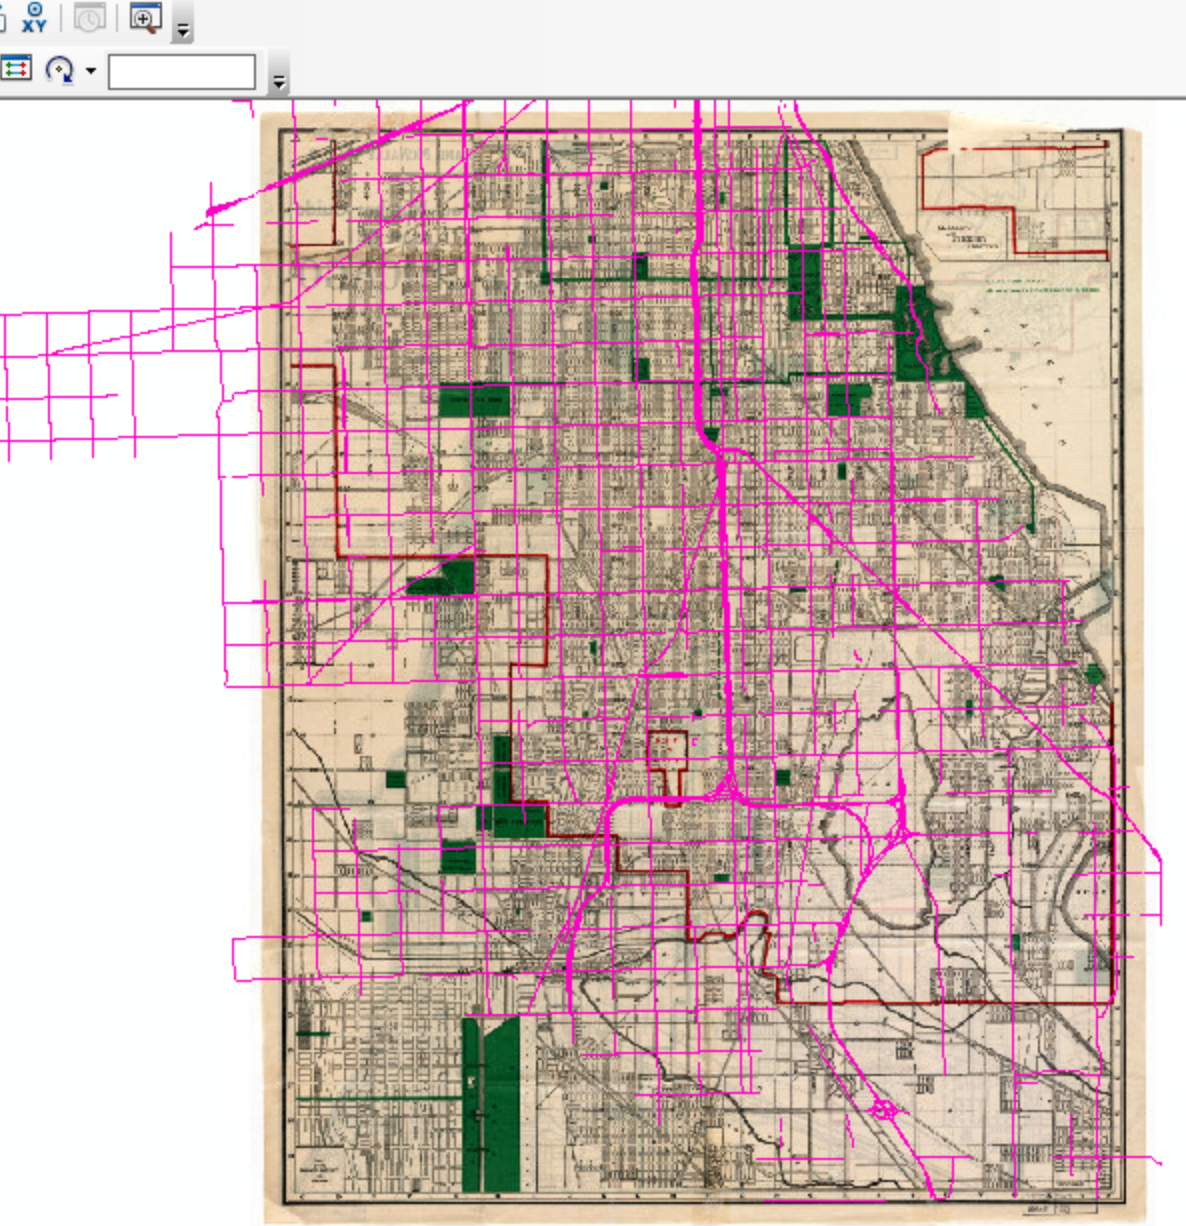
Once you are more familiar with streets on the map and streets in the Major_Streets dataset, you will see that the map only covers the bottom portion of the Major_Streets dataset. You can zoom in to this area and then select Fit to Display on the Georeferencing toolbar again to start the georeferencing process with the map closer to its actual position.
Starting Georeferencing: Adding Control Points
To start the Georeferencing process you will need to add Control Points. These are like anchors that connect locations on the map to locations on the Major_Streets dataset. You will always add Control Points by starting with a position on the map and ending with a position on the Major_Streets dataset.
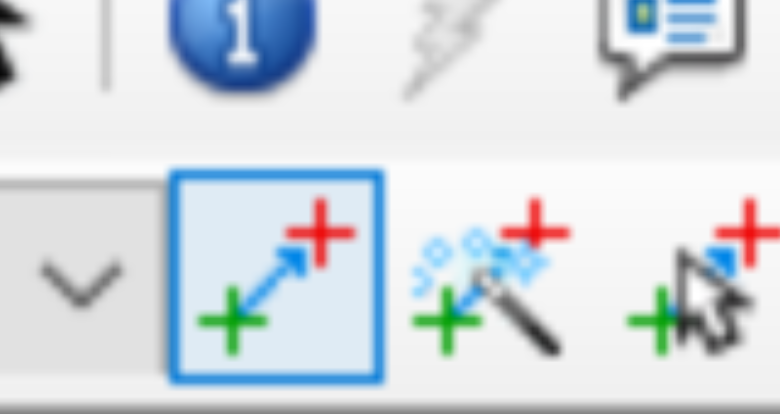
To start adding Control Points select the Control Points button on the Georeferencing toolbar. It looks like a green X and an arrow pointing to a red X.
Adding the First Control Point
Now you can start adding Control Points. I started with Archer Street because the bend that the street makes is easy to find. Zoom in so that you can easily see street names and streets on the map. In this example the locations are close together because I started from displaying the map close to its actual location.
- Locate the bend of Archer Street on both the Chicago map and the
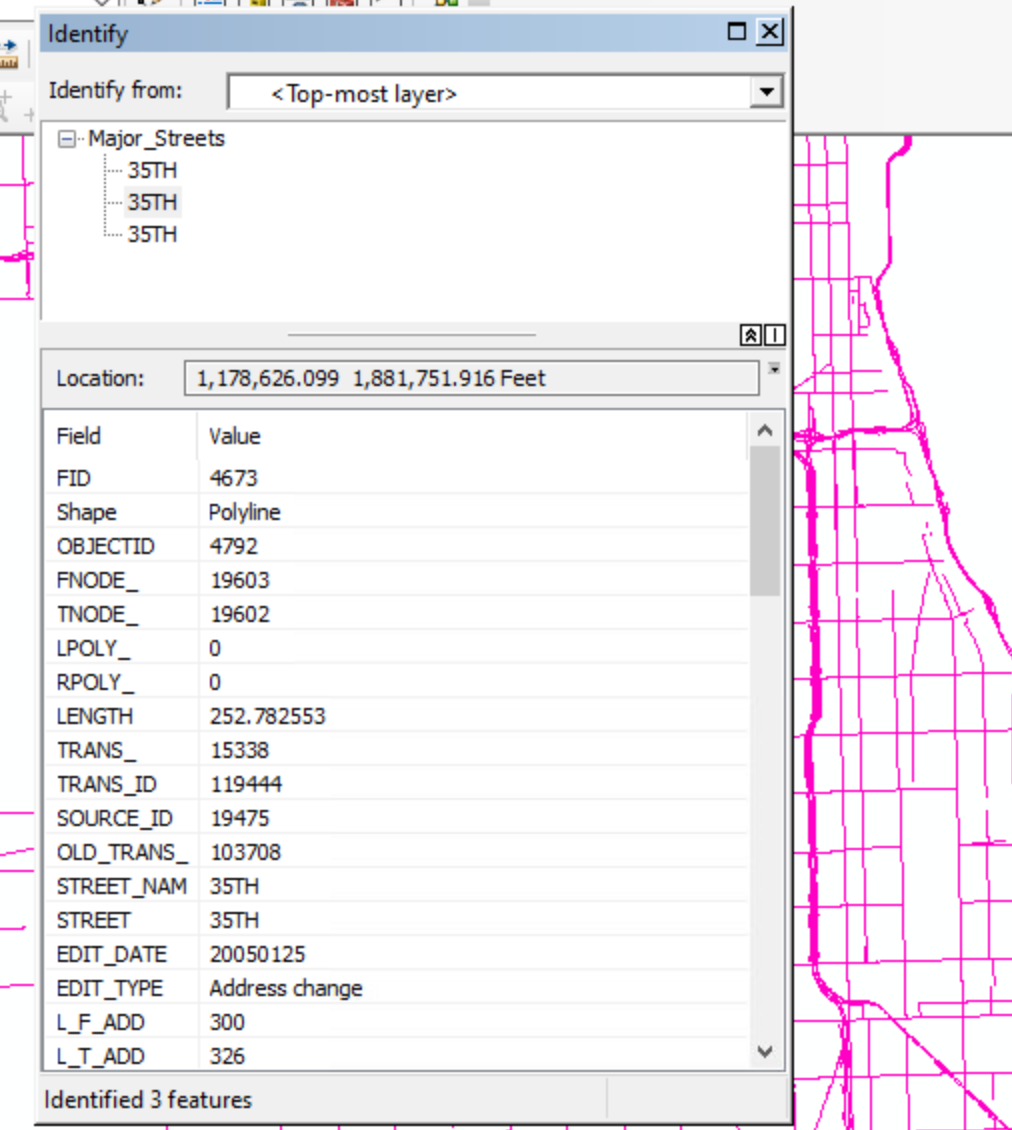
Major_Streetsdataset. Use theIdentifytool to make sure you have found Archer Street on theMajor_Streetsdataset. - With the
Control Pointsbutton selected, click on the reference point (the bend of Archer Street) on the Chicago Map. You will see a green cross with a number1at that point and as you move your mouse you will see a line connecting the green cross with your mouse position. - Next click on the bend of Archer Street on the
Major_Streetsdataset. Because this is the first control point, the Chicago map will shift so that the two points are in the same place so you will then see a red cross with a number1at that point and the streets will start to align with the Chicago map.
 |
 |
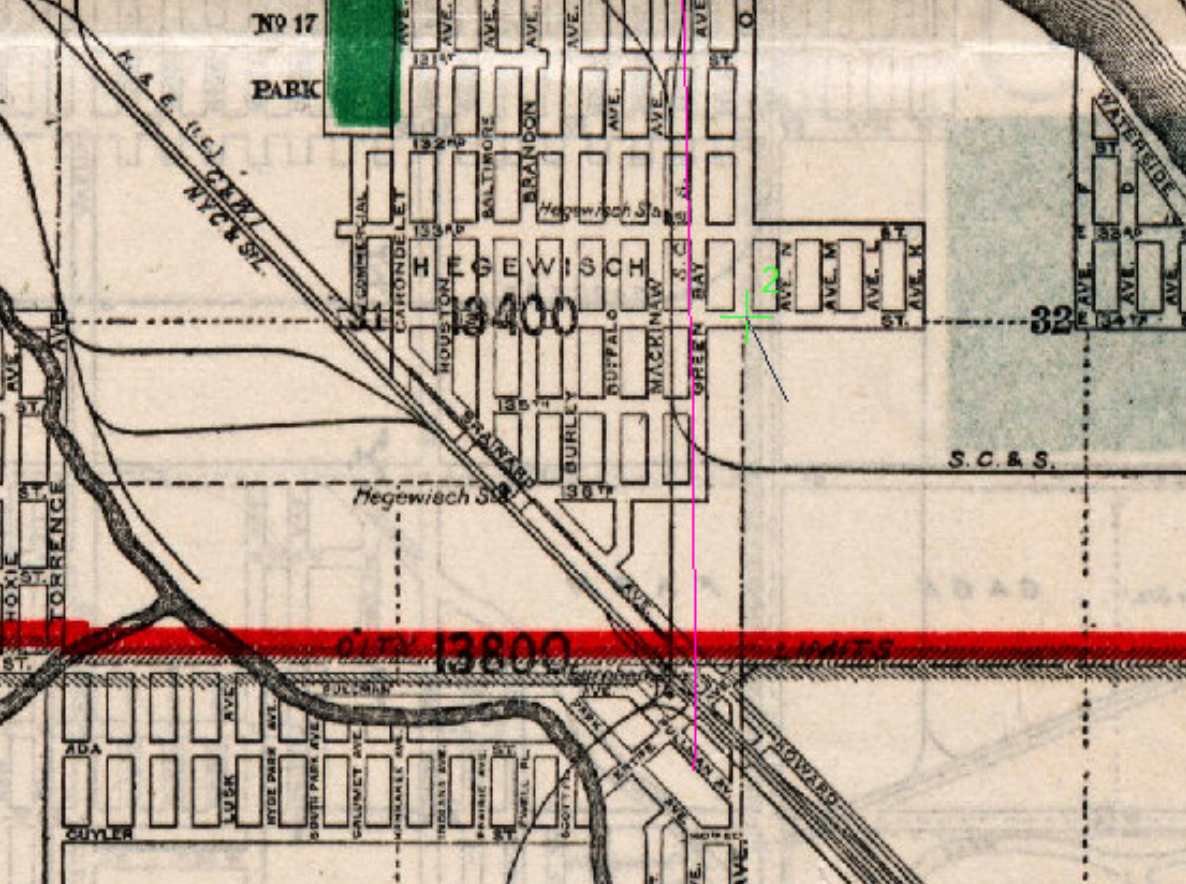
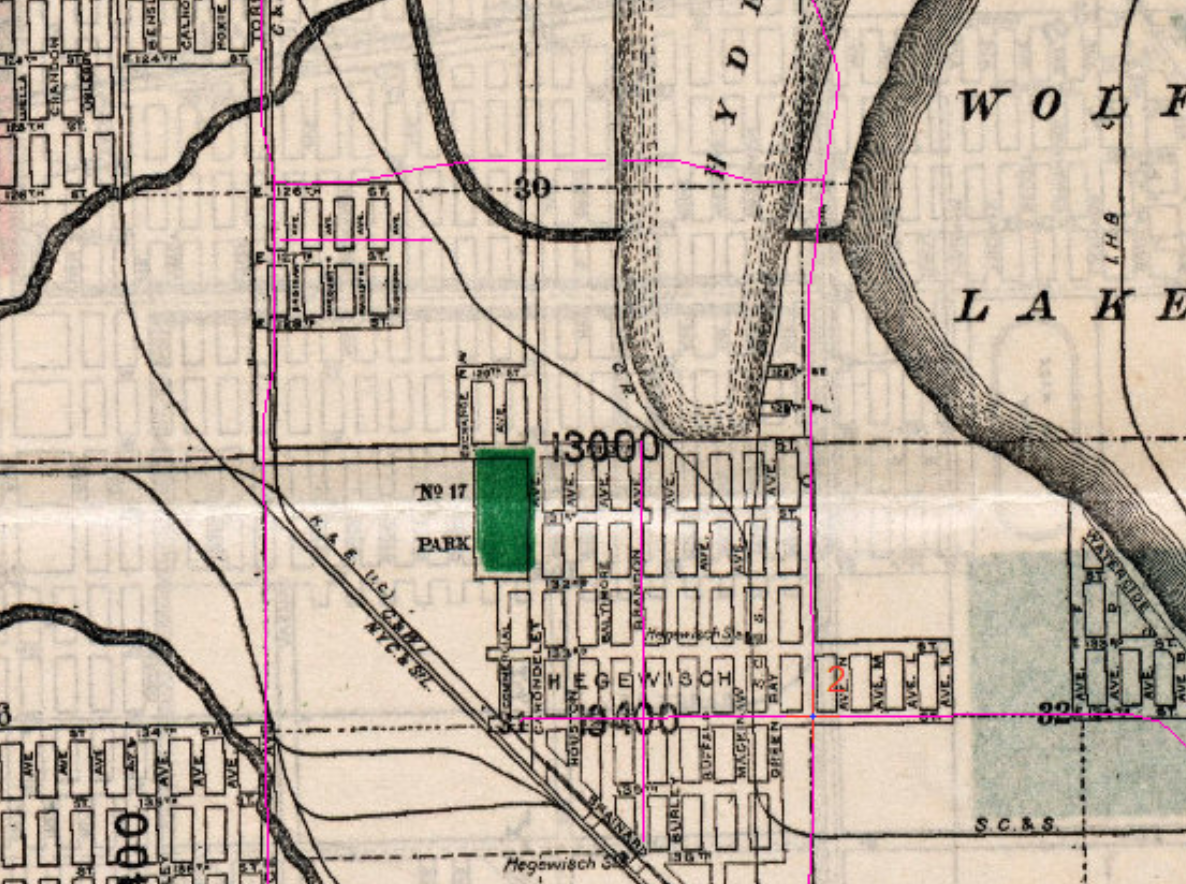
Adding the Second Control Point
Next you will add the second Control Point. It is best if you do this on the oposite corner of the map from your first control point. In this example, I used the intersection of 134th street and Avenue O.
- Locate the intersection of 134th street and Avenue O on both the Chicago map and the
Major_Streetsdataset. Use theIdentifytool to help find the streets. - With the
Control Pointsbutton selected, click on the reference point (the intersection of 134th street and Avenue O) on the Chicago Map. You will see a green cross with a number2at that point. - Next click on the intersection of 134th street and Avenue O on the
Major_Streetsdataset. The map will shift again so that the two points are approximately in the same place and the streets in the area should line up.
 |
 |
Checking the Full Map
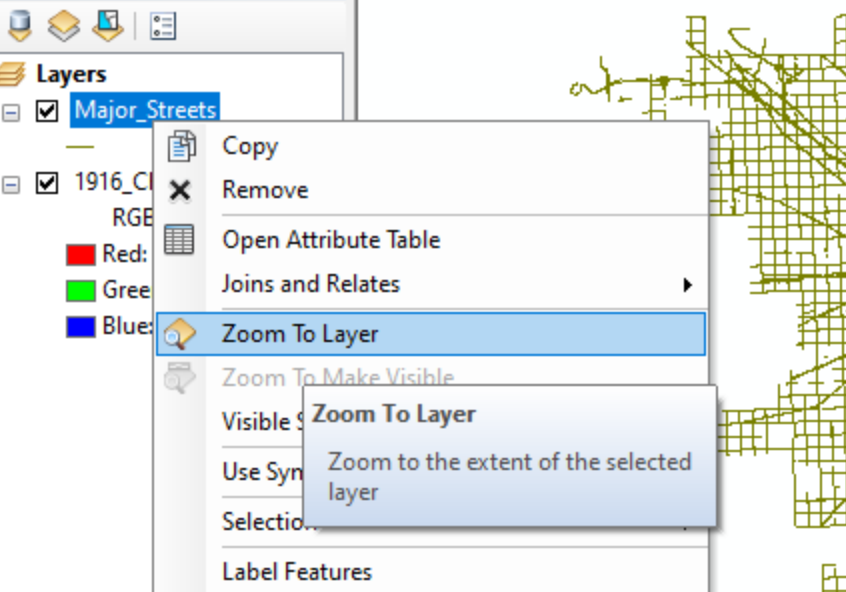
After you have added two Control Points in oposite corners of the Chicago map, zoom to the full map (right cick on the map and select Zoom to Layer) and see how well it is currently lined up with the Major_Streets dataset. It should match pretty well at this point.
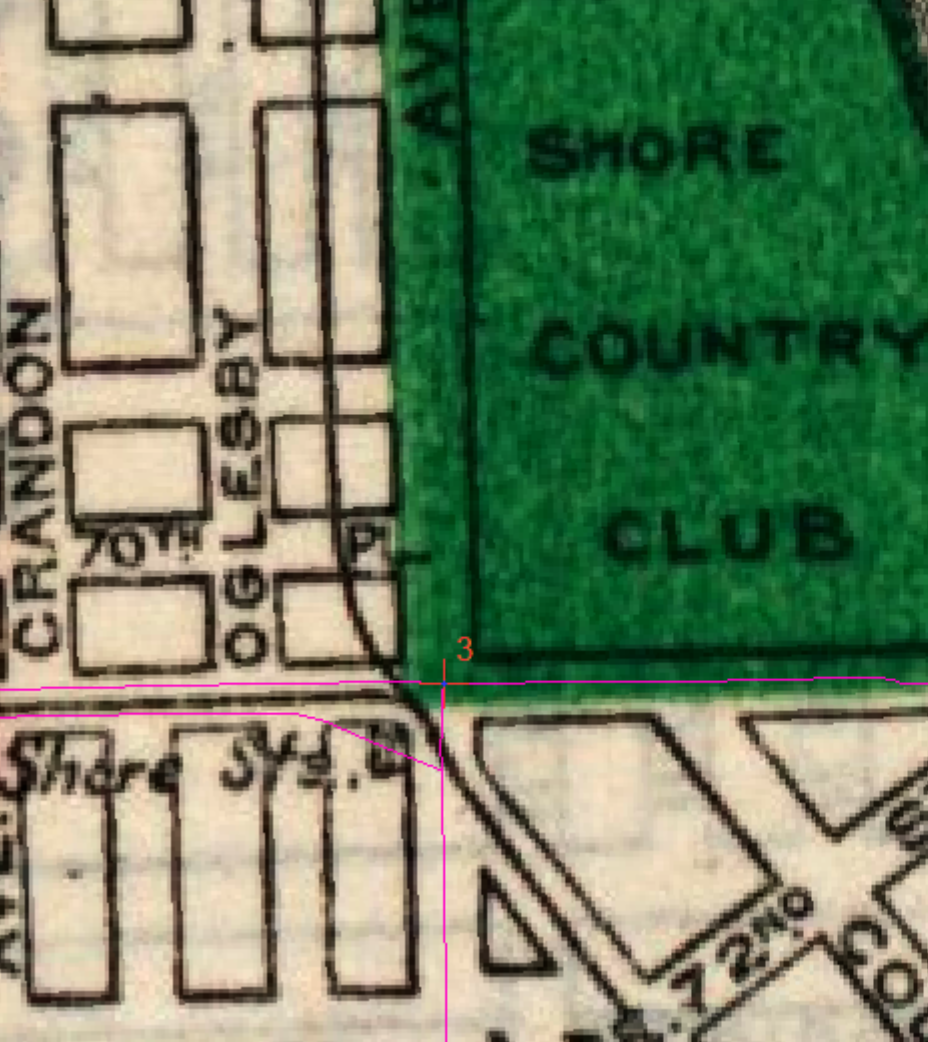
Adding the Third Control Point
Now it is good to add a third Control Point in another corner of the Chicago map. For this example, I choose the intersection of 71st and Yates. The Major_Streets road and the Chicago map were well lined up at this location, so I simply clicked twice to add a Control Point in the same spot in both. Even if the map lines up well already in this corner it is good to add a Control Point as ArcMap will continue making adjustments to the map as you add more Control Points.
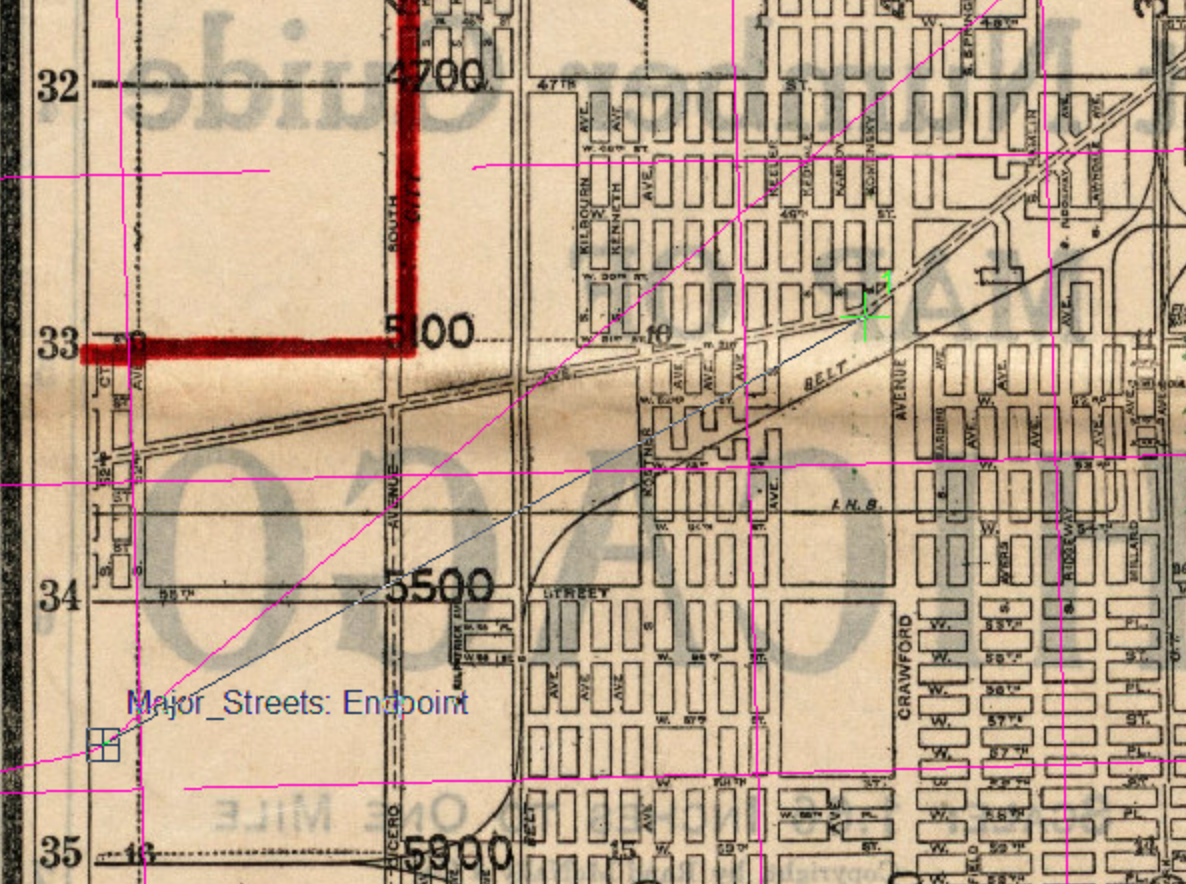
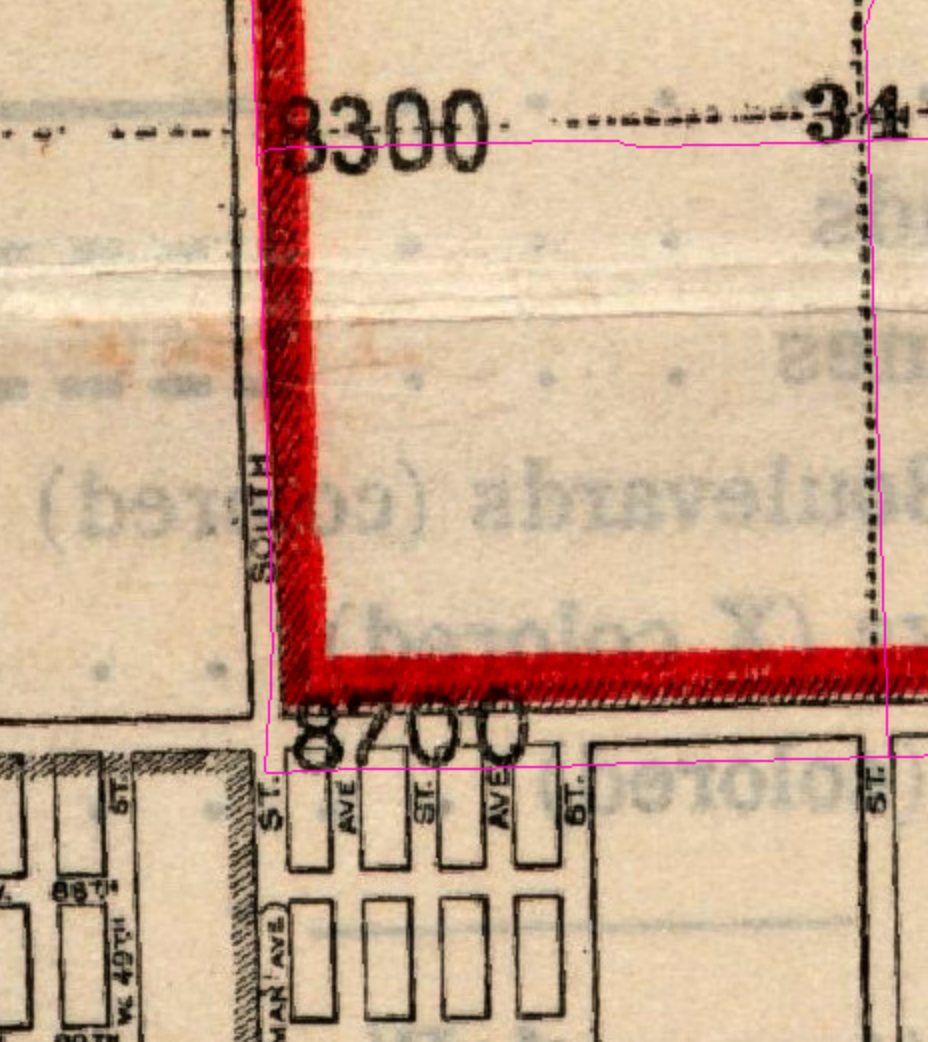
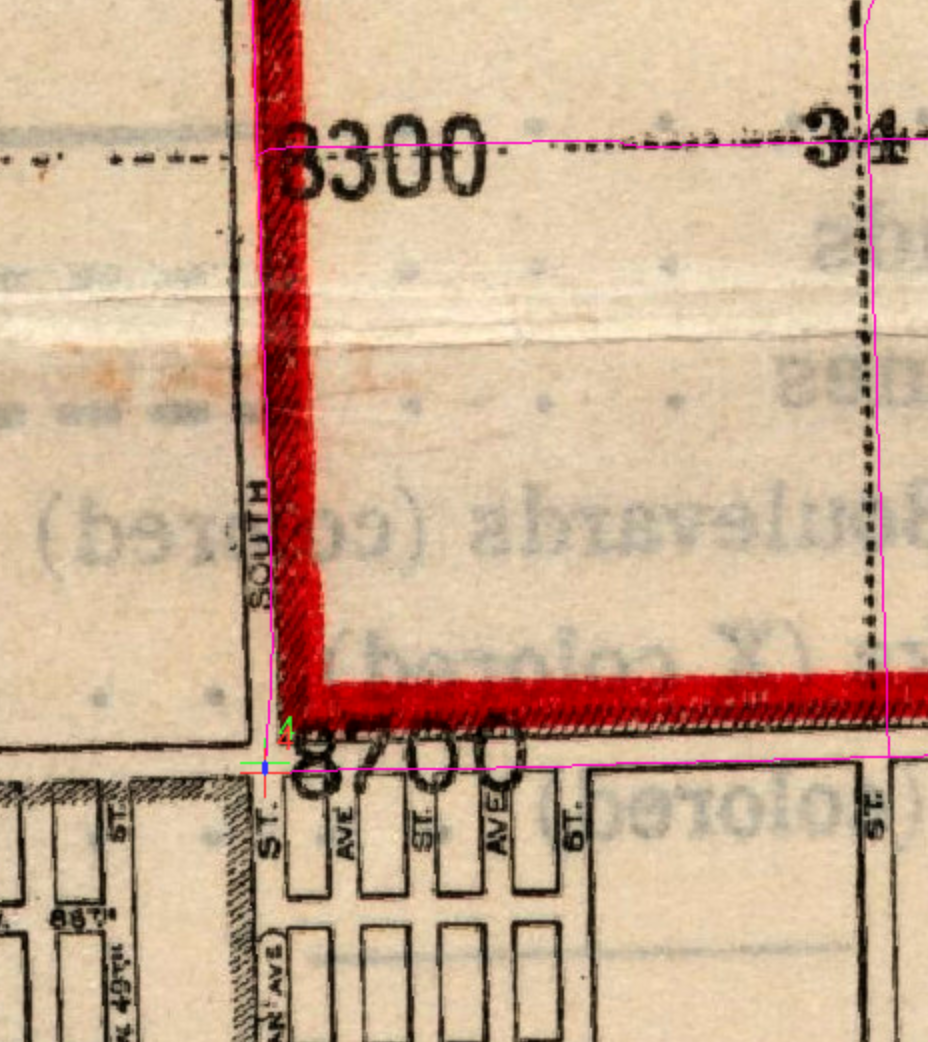
Adding the Fourth Control Point
Finally I added a fourth Control Point near the last corner of the map. As the map and Major_Streets were slightly off here I first clicked on the intersection of Cicero and 87th on the Chicago map then on the Major_Streets intersection.
 |
 |
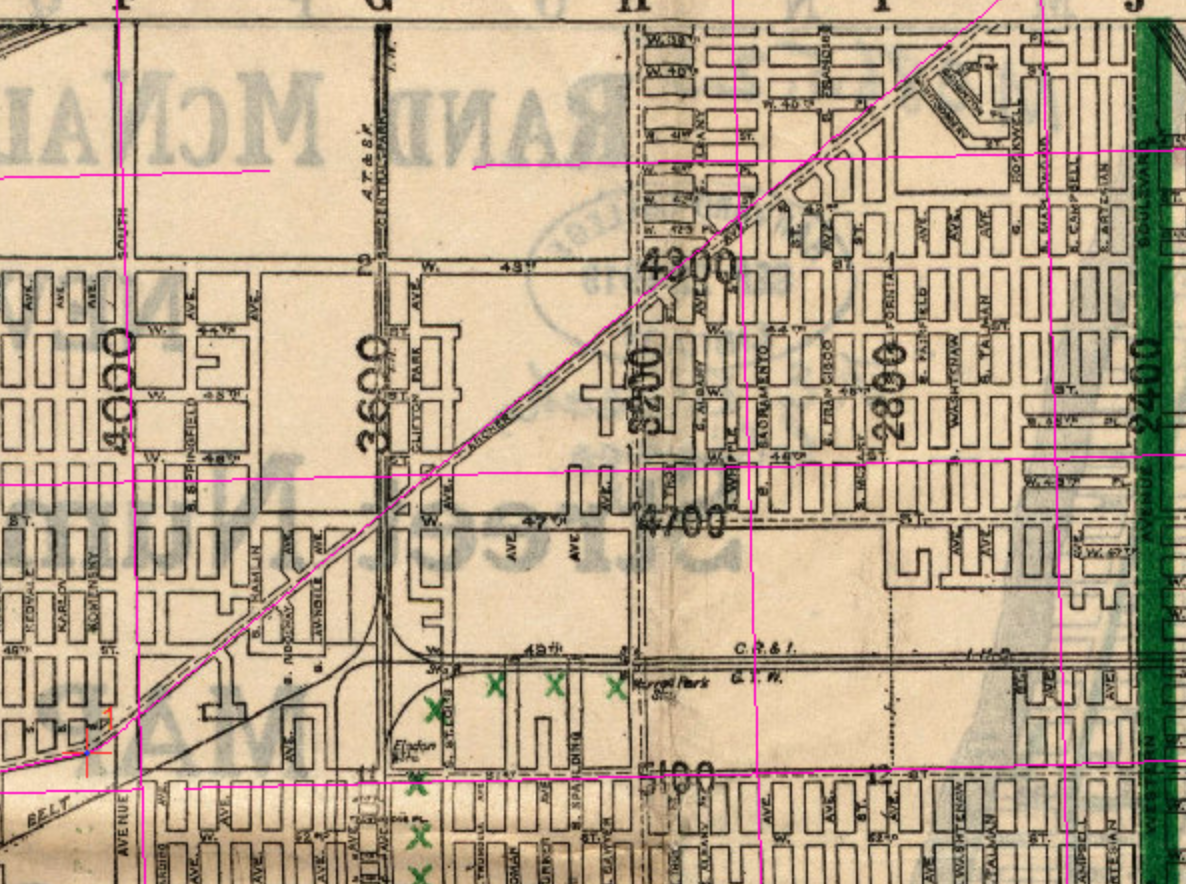
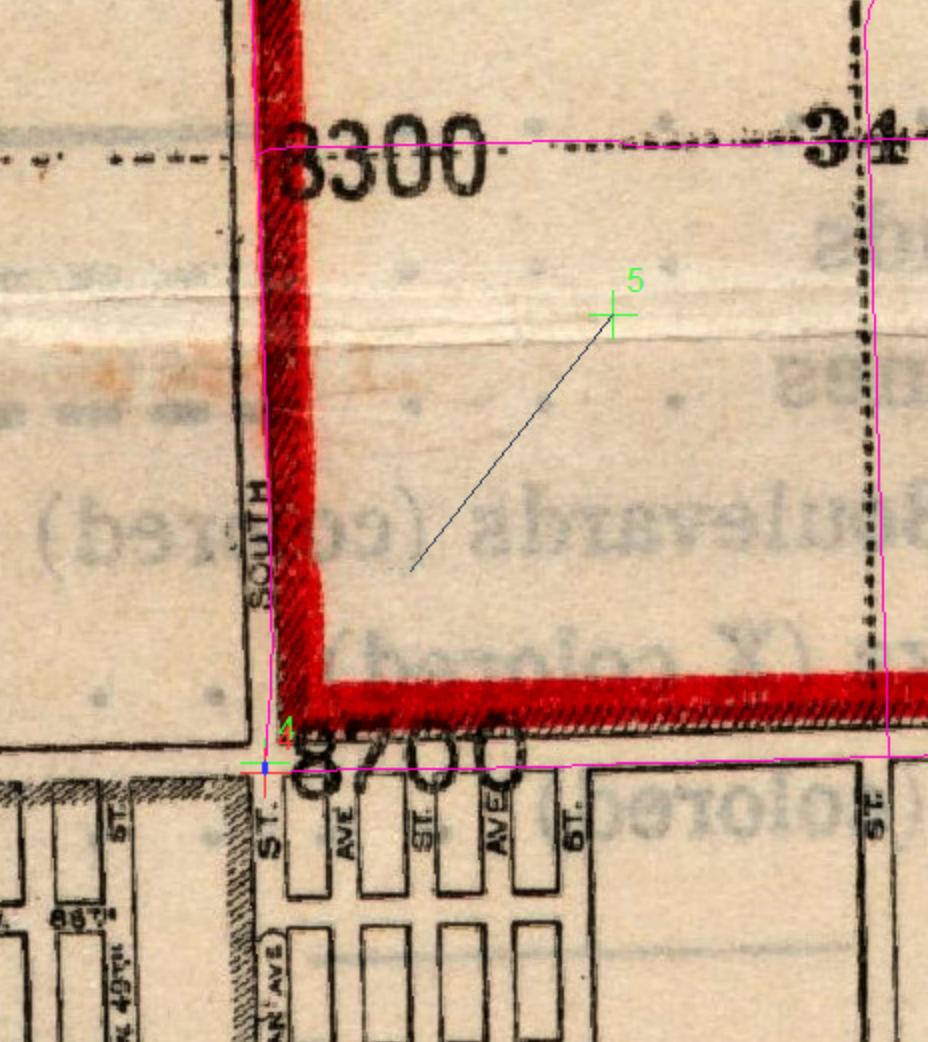
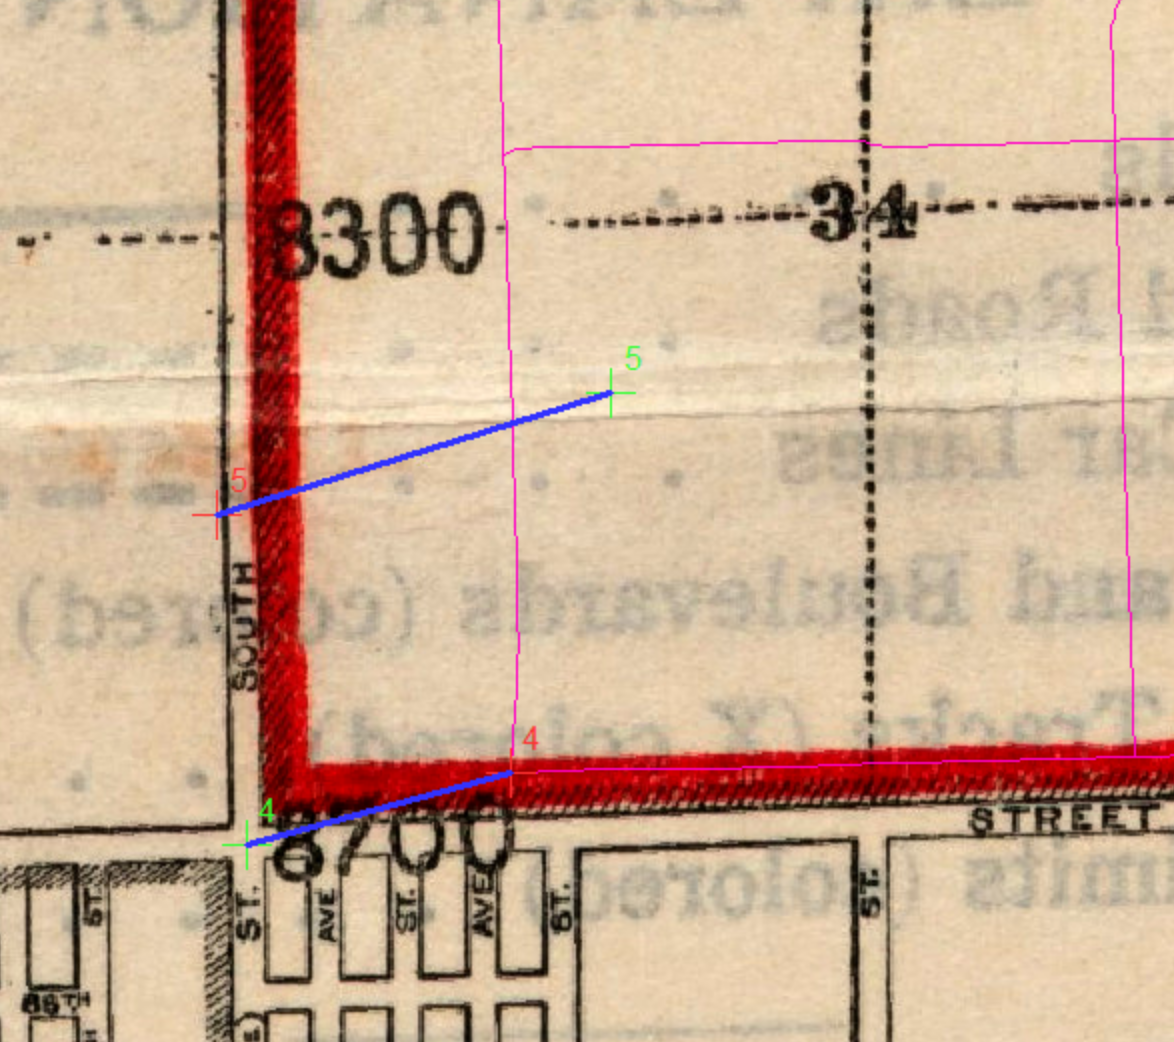
Fixing a Bad Control Point
Finally, what happens if you add a bad Control Point? In this example I added a bad fifth control point where I clicked in the center of the block and matched it with a section of Cicero Avenue. This shifted the Chicago map again, and now you can see large blue lines between my two fourth Control Points, which had been in the correct location, and my two bad fifth Control Points. Large blue lines between Control Points is a sign that the map and the data layer is not well aligned.
 |
 |
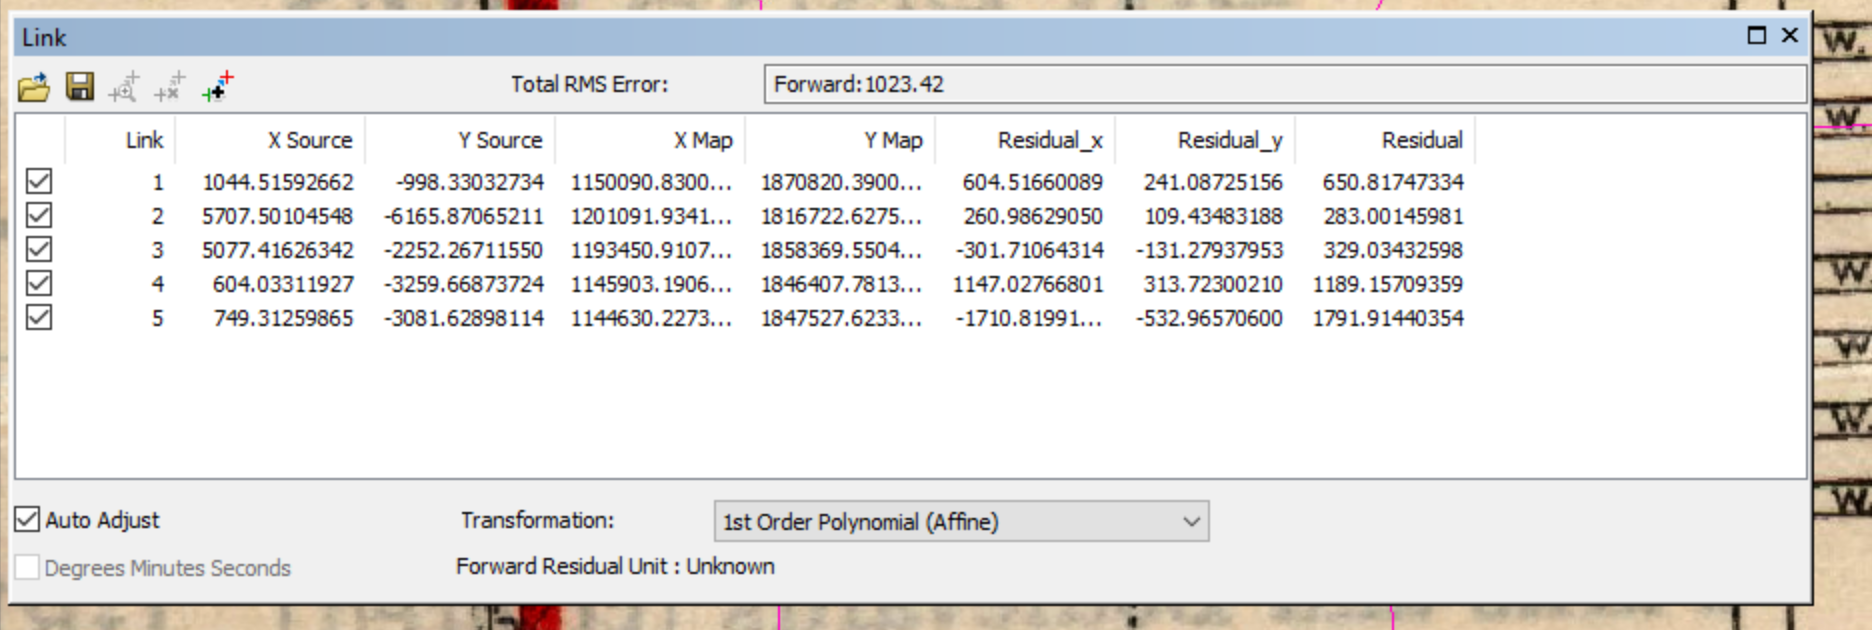
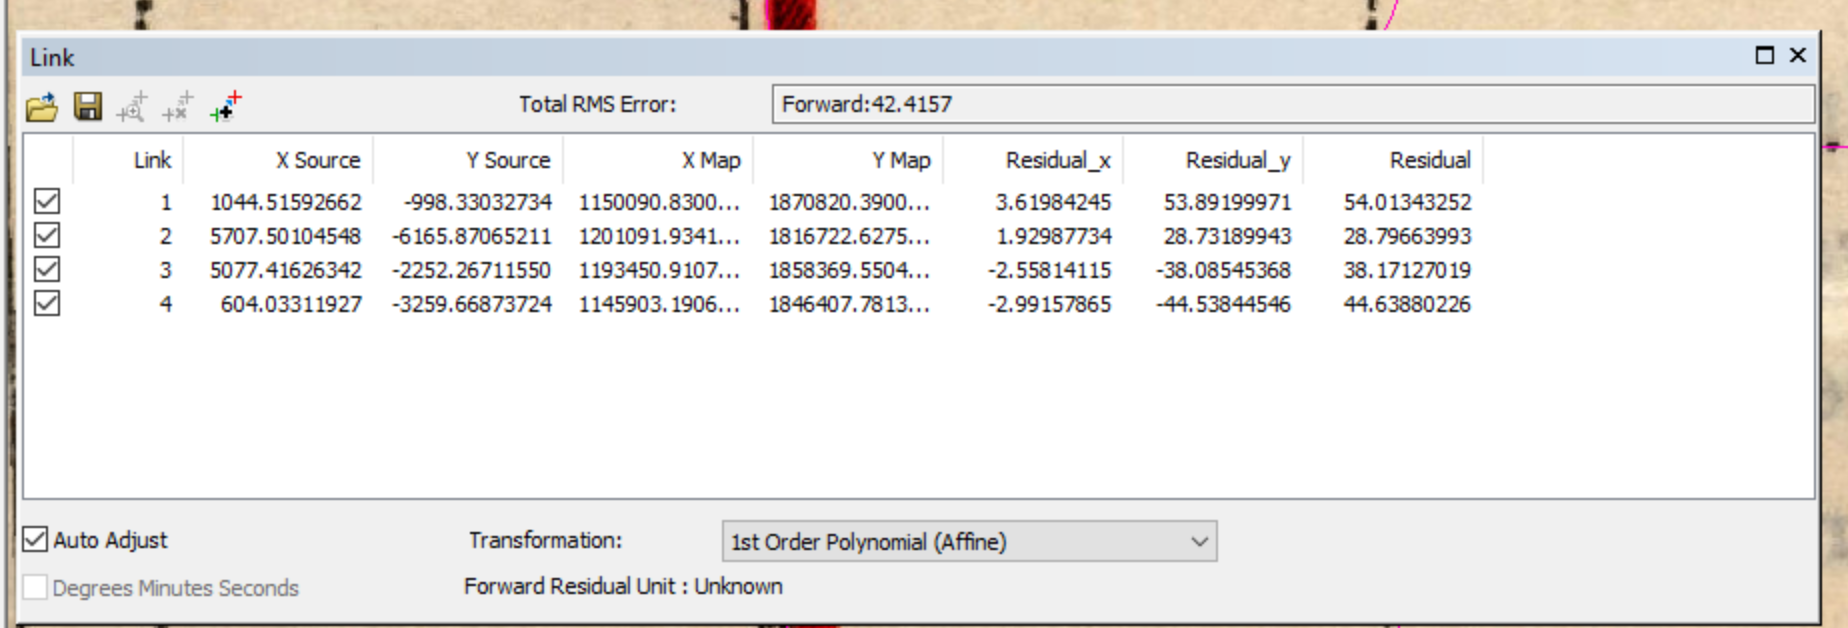
To fix this I first opened the Link table by pressing the Link table button in the Georeferencing toolbar.

There are very large numbers in the Residual column in the Link table, which is a bad sign. The values for the bad fifth Control Point are the largest.
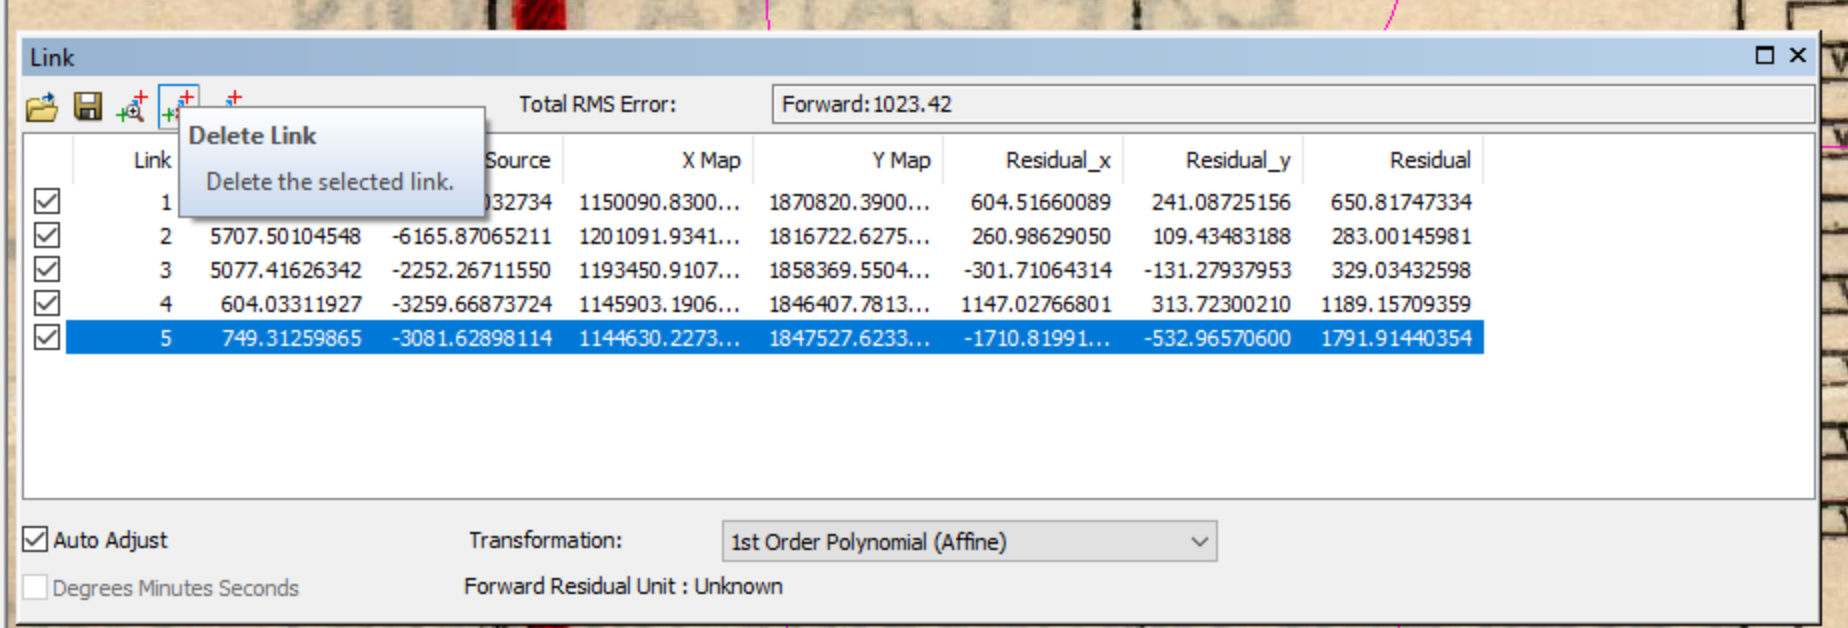
To fix this I simply clicked on the row for the fifth Control Point and selected the Delete Control Point button at the top of the toolbar in the Link dialog box. Afterwards you can see that the values in the Residual columns are much smaller. It will be impossible for each of the values to be zero as some error in this process is expected.
Completing the Georeferencing Process: Rectifying
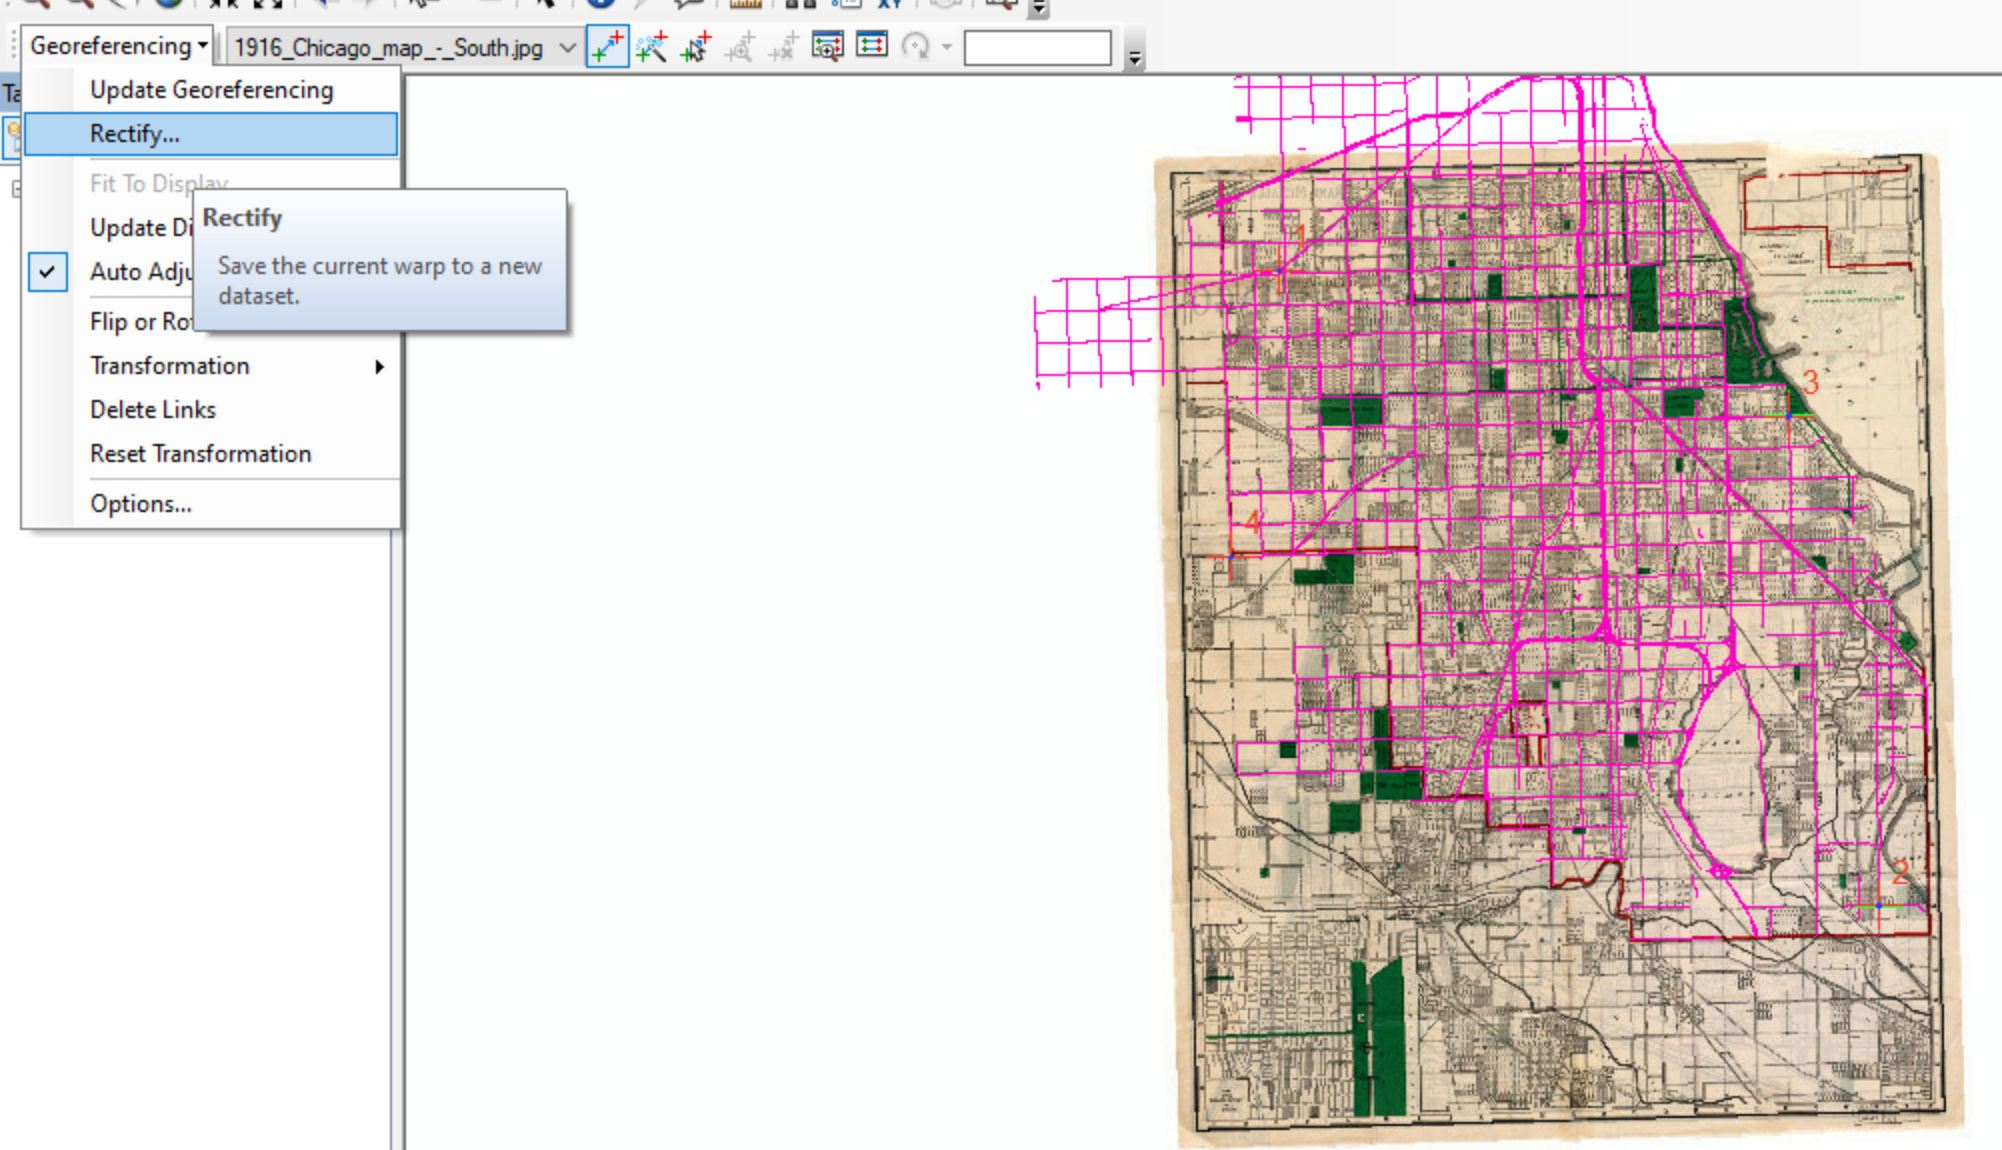
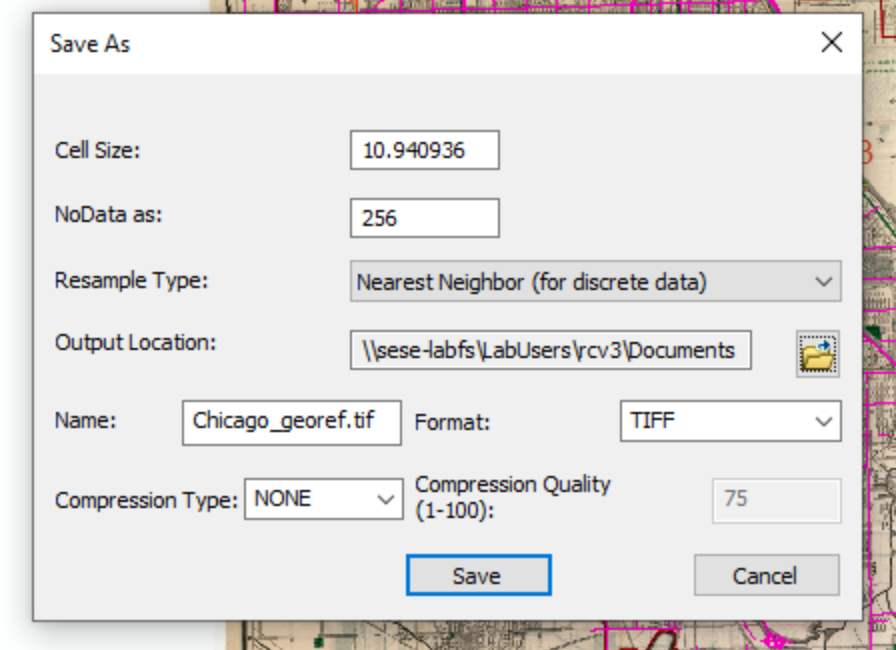
Once you are satisfied with the control points, you will need to complete the georeferencing process and save the final image. In the Georeferencing toolbar select Rectify.... This will open the Save As dialogue box as you will be saving a copy of the image that includes spatial information. A common format is a GeoTIFF file, which is a TIFF image file that includes spatial information (it will just appear as TIFF in this box). Click on the folder icon to change the output location to the folder that you want to save the image in. You can also change the name of the final image if you would like.
 |
 |
Loading the Rectified Image
Now you can open the final rectified image in ArcMap using the Add Data button. It will show up in the Table of Contents and will be displayed on the screen.
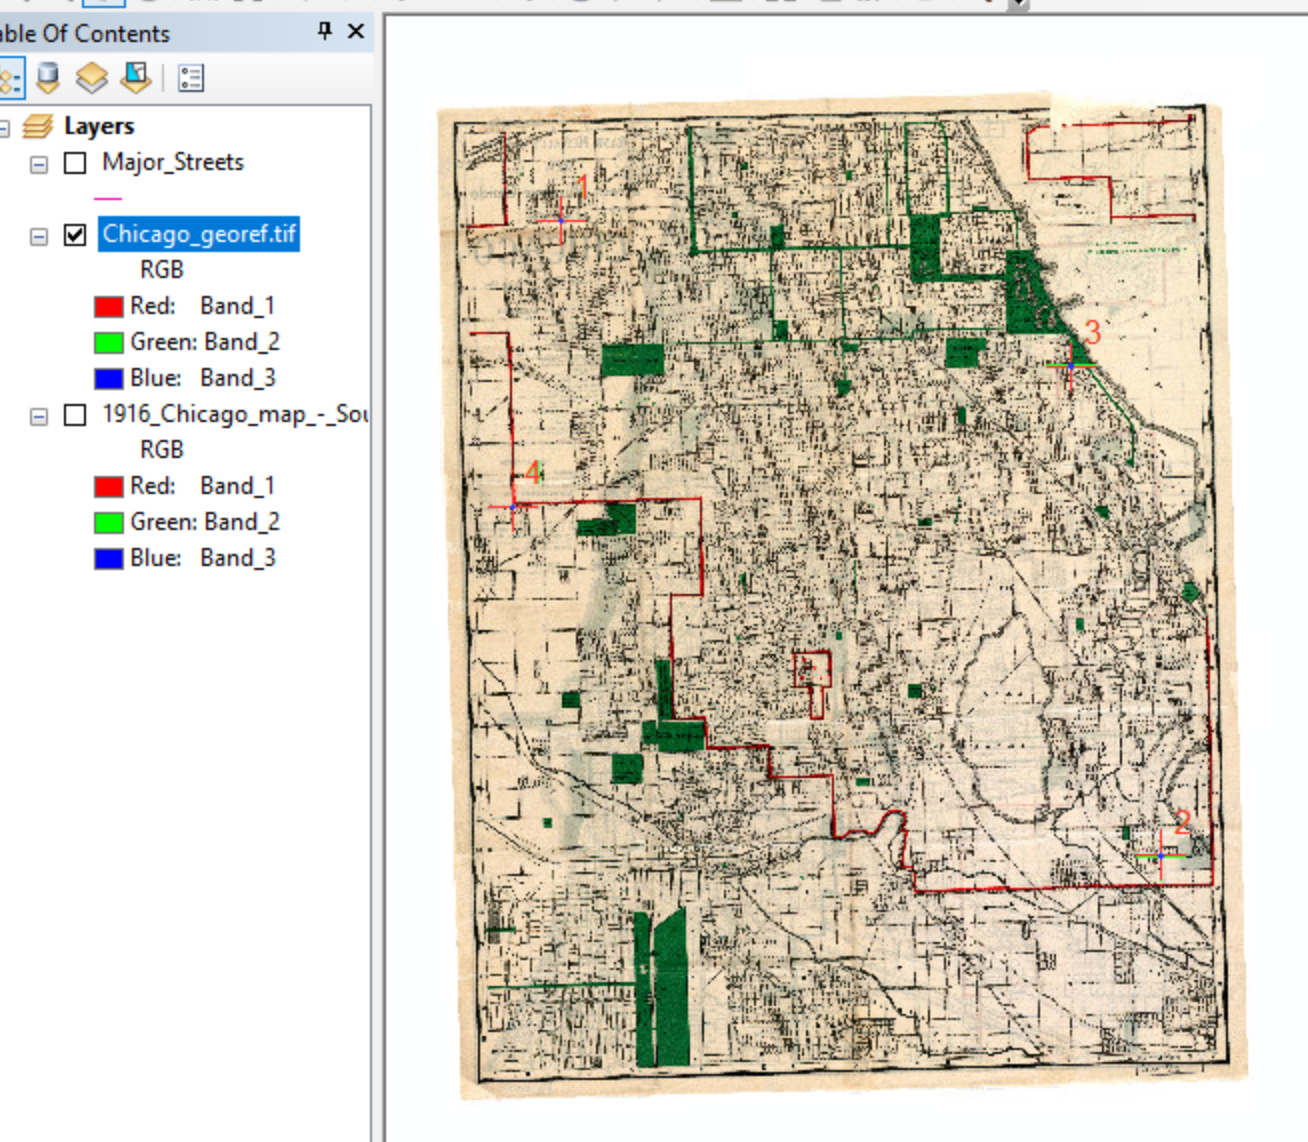
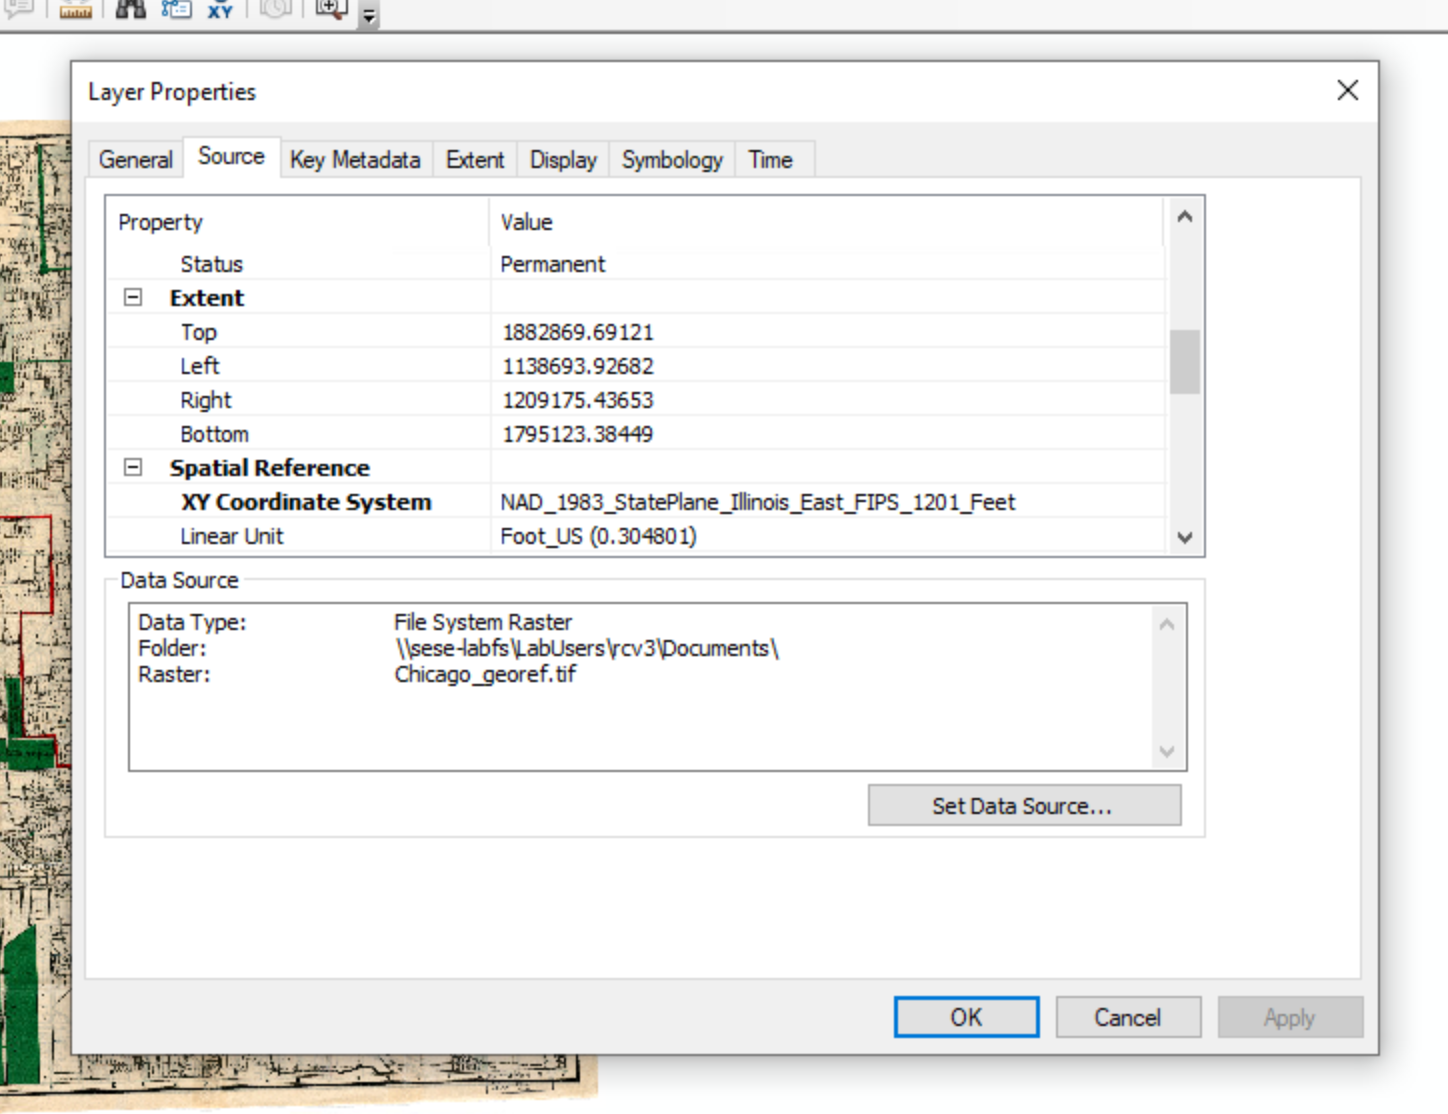
Right click on the final image in the Table of Contents pane and select Properties... and click on the Source tab. You can now see that the image has spatial reference information which is the same as the Major_Streets dataset.
Large Image Size
The rectified image will be larger that the starting image. It could easily be too big to transfer in and out of a remote desktop. If this is the case, using a cloud based data storage system, such as Illinois Box, could be helpful in transfering the file.